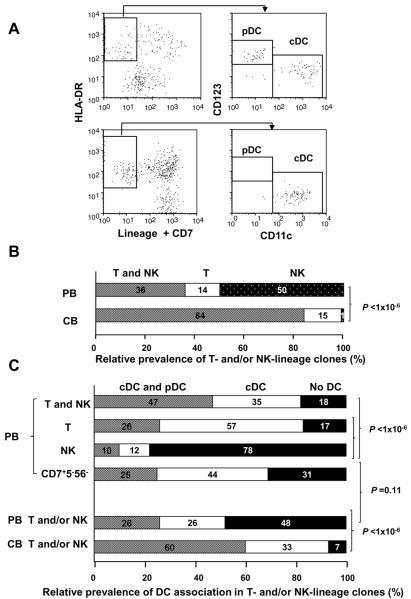
Figure 5. Analyses of cDC/pDC and T/NK-lineage progenies derived from a single PB and CB HPC.
PB and CB HPCs from each donor were sorted into more than 560 wells with 384-well plates in OP9-DL1 co-cultures at a frequency of one cell per well. After five-week culture, wells exhibiting cell growth were analyzed for surface phenotypes of cDC/pDC and T/NK lineages.
(A) Representative flow cytograms of CD11c and CD123 expressions in HLA-DR+Lin−-gated progenies from a single CD34+Lin− cell. Each precursor was classified as cDC/pDC dual-lineage (upper panel) or cDC single-lineage (lower panel).
(B) Different distributions of precursor clones producing T and/or NK-lineage progenies between PB and CB CD34+Lin− cells. Classifications of T/NK dual-lineage, T single-lineage, and NK single-lineage progenies were noted in the previous report (26). Distribution of each lineage is expressed as the relative prevalence calculated from the data listed in Table II. The difference in distribution of the T/NK-precursor clones between PB and CB was highly significant by chi-square test based on the number of clones (P<1×10⁻⁶).
(C) Classification of precursor clones producing cDC/pDC-dual or pDC-single lineage in combination with T/NK-dual lineage, T-single lineage, NK-single lineage, and CD7+CD5−CD56− phenotypes in PB and CB HPCs. Distribution of each lineage is expressed as a relative prevalence obtained from the data listed in Table II. The difference in distribution of the cDC/pDC-precursor clones between T/NK dual- and NK single-, as well as between T single- and NK single-lineage phenotypes in PB (upper), was highly significant by chi-square test based on the number of clones (P<1×10⁻⁶). The difference in distribution of the cDC/pDC-precursor clones in association with T and/or NK lineage between PB and CB (lower) was highly significant by chi-square test (P<1×10⁻⁶). Distribution of the cDC/pDC-precursor clones in association with CD7+CD5−CD56− phenotype did not differ from that with T and/or NK phenotype in PB HPCs (P = 0.11)

