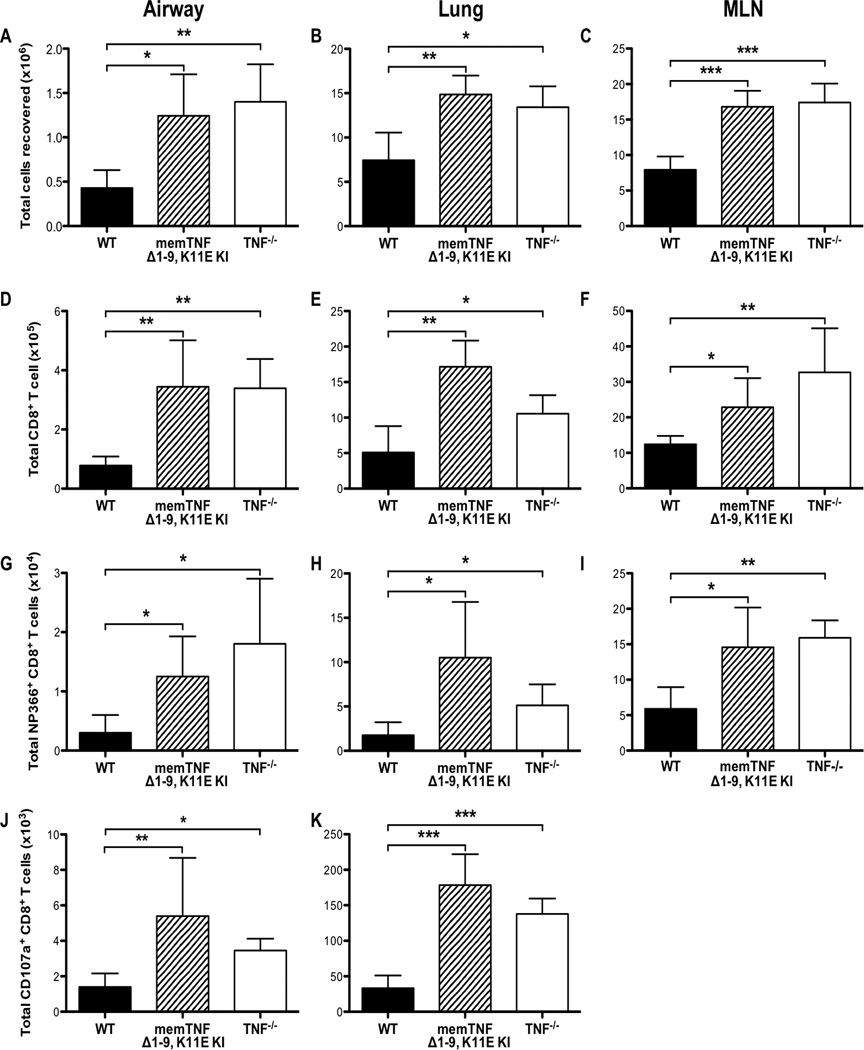
Figure 3. Enhanced CD8+ T-cell responses in memTNFΔ1–9, K11E KI and TNF−/− mice following influenza infection.
WT, memTNFΔ1–9, K11E KI, and TNF−/− mice were infected with a sub-lethal dose of influenza virus and cells were harvested from the airways, lung, and MLN on day 8 post-infection. Total number of viable cells recovered from (A) BAL, (B) lung, and (C) MLN. Total number of CD8+ T cells from (D) BAL, (E) lung, and (F) MLN. Total number of NP366–374-specific CD8+ T cells from (G) BAL, (H) lung, and (I) MLN. Total number of CD107a+CD8+ T cells from (J) BAL and (K) lung. Data represent mean ± standard deviation. Each group consists of 4–6 mice. Data are representative of at least three independent experiments. *P<0.05, **P<0.01, ***P<0.005.

