Figure 3.
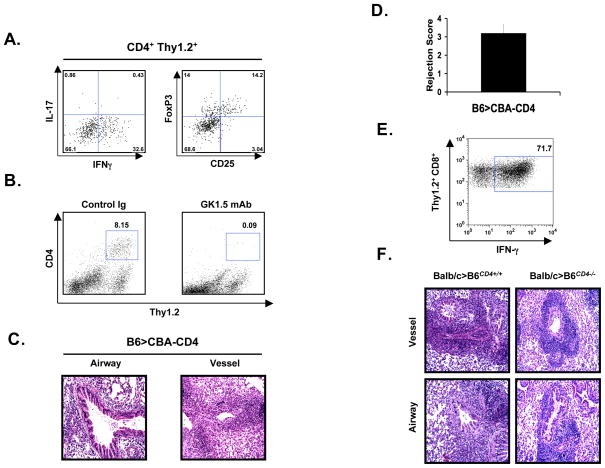
Histological and flow cytometric analysis of B6 → CD4+-depleted CBA/Ca lung grafts 7 days after transplantation (n=4). (A) Flow cytometric analysis of live Thy1.2+ CD4+ T cells in B6 → CBA lungs transplants 7 days after engraftment. Plots are representative of 3 independent experiments. (B) Intragraft live Thy1.2+ CD4+ cells in control Ig-treated (left) and GK1.5-treated (right) CBA recipients of B6 lungs 7 days after engraftment. (C) H&E slides are represented at 400X magnification. (D) Rejection score represented as a mean ± S.E.M. recipient. Statistical analysis was conducted with the Student’s t test; B6 → CBA-CD4 vs. B6 → B6 p<0.05, B6 → CBA-CD4 vs. B6 → CBA p>0.1, B6 → CBA-CD4 vs. B6II- → CBA p>0.1. (E) Flow cytometric plots depict the percentage of live intragraft Thy1.2+ CD8+ cells that have the capacity to produce IFN-γ. Mean percentage ± S.E.M of IFN-γ producing Thy1.2+ CD8+ cells was 68.5 ± 4.1. Statistical analysis was conducted with the Student’s t test; B6 → CBA-CD4 vs. B6 → B6 p<0.05, B6 → CBA-CD4 vs. B6 → CBA p>0.1, B6 → CBA-CD4 vs. B6II- → CBA p>0.1. (F) H&E slides of Balb/c → B6CD4+/+ (n=4) and Balb/c → B6CD4−/− (n=2) 7 days after transplantation. Rejection scores were A3 for all recipients in both experimental groups.

