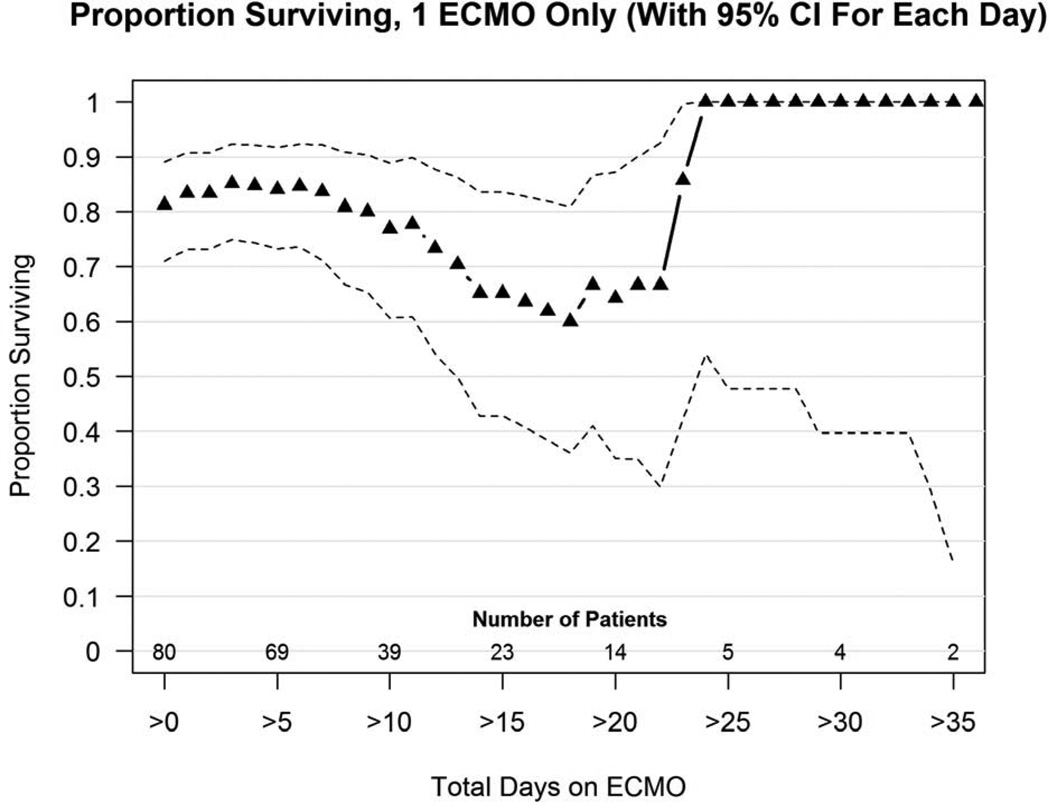
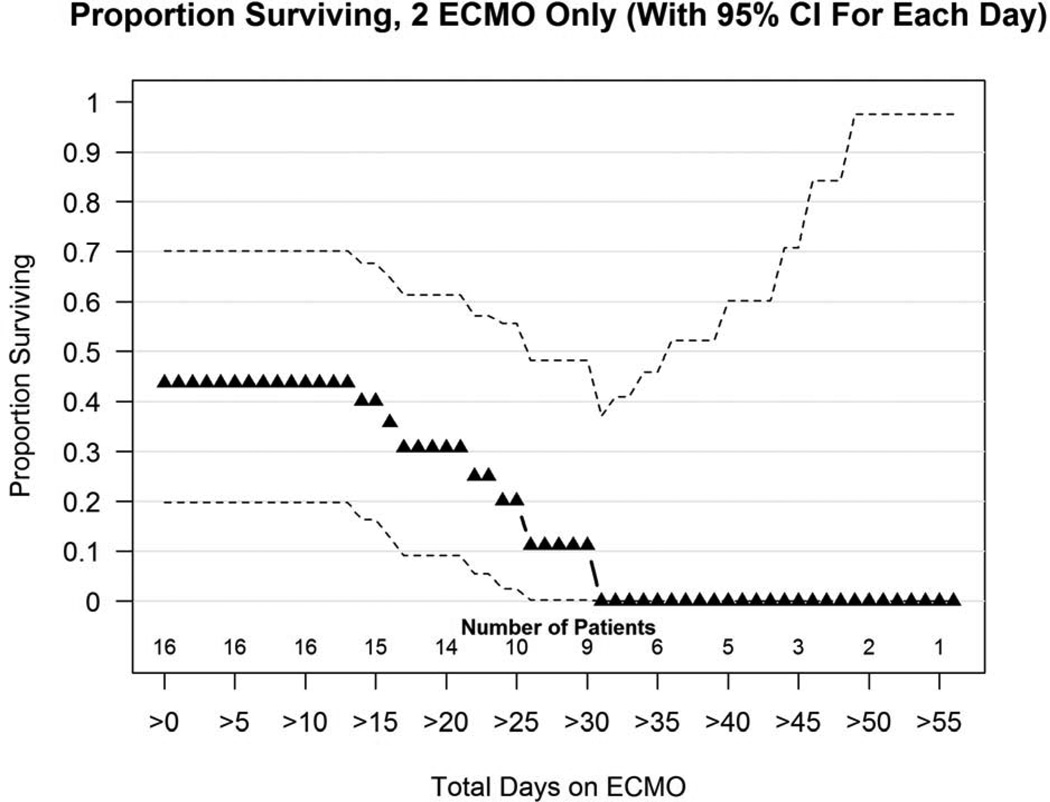
Figure 2.
a and 2b: (a). Proportion surviving versus days on ECMO for 80 CDH patients who required just 1 ECMO run. (b) Proportion surviving versus days on ECMO for 16 patients treated with a second ECMO run. Number of patients still on ECMO is shown along the bottom of the graph. Triangles represent the percent of patients still on ECMO at any time point who survive to discharge. Dotted lines represent confidence intervals.


