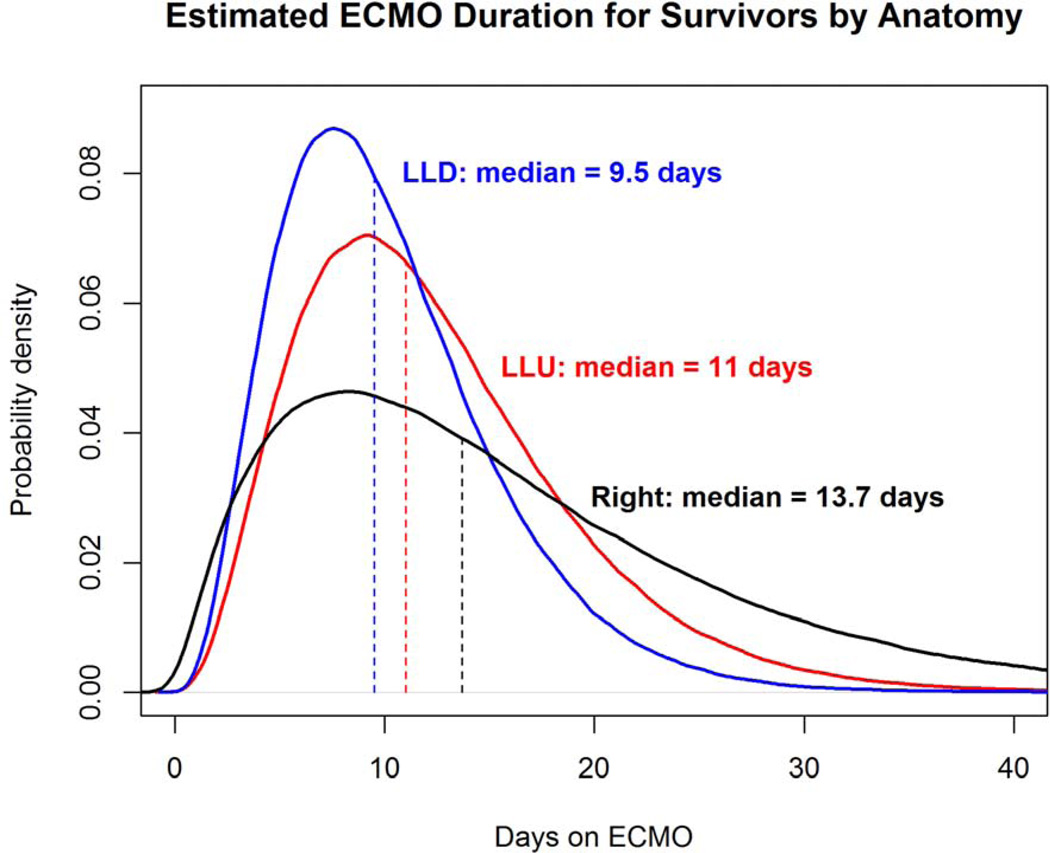
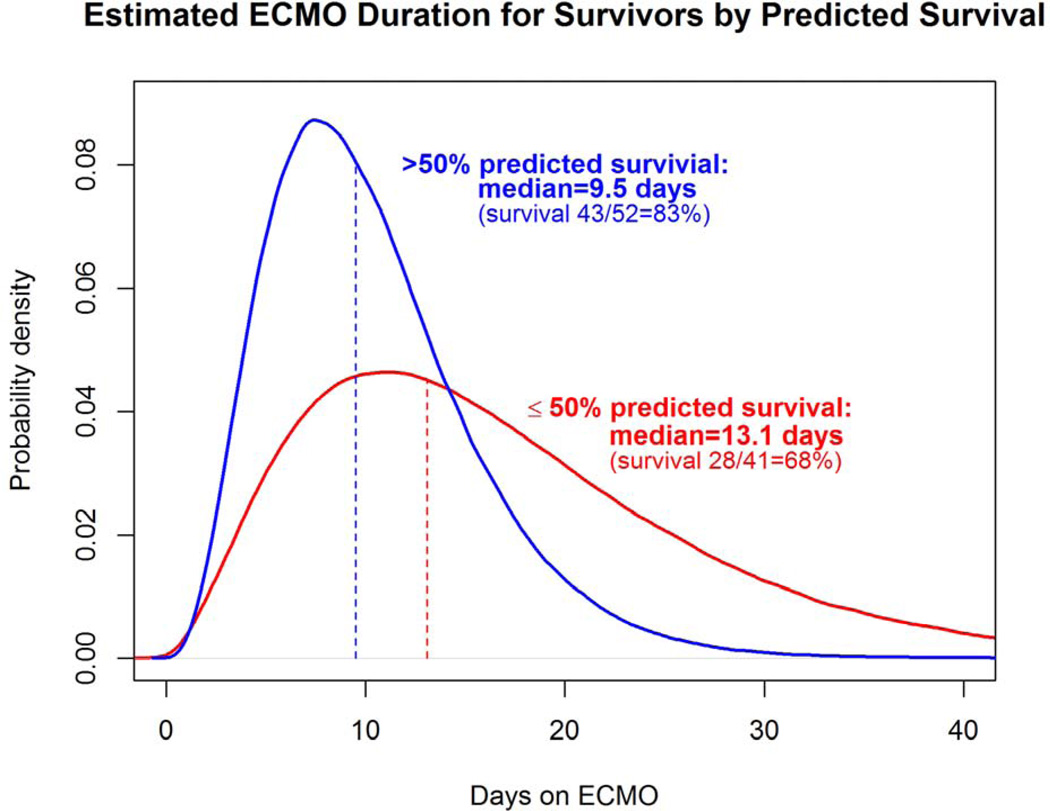
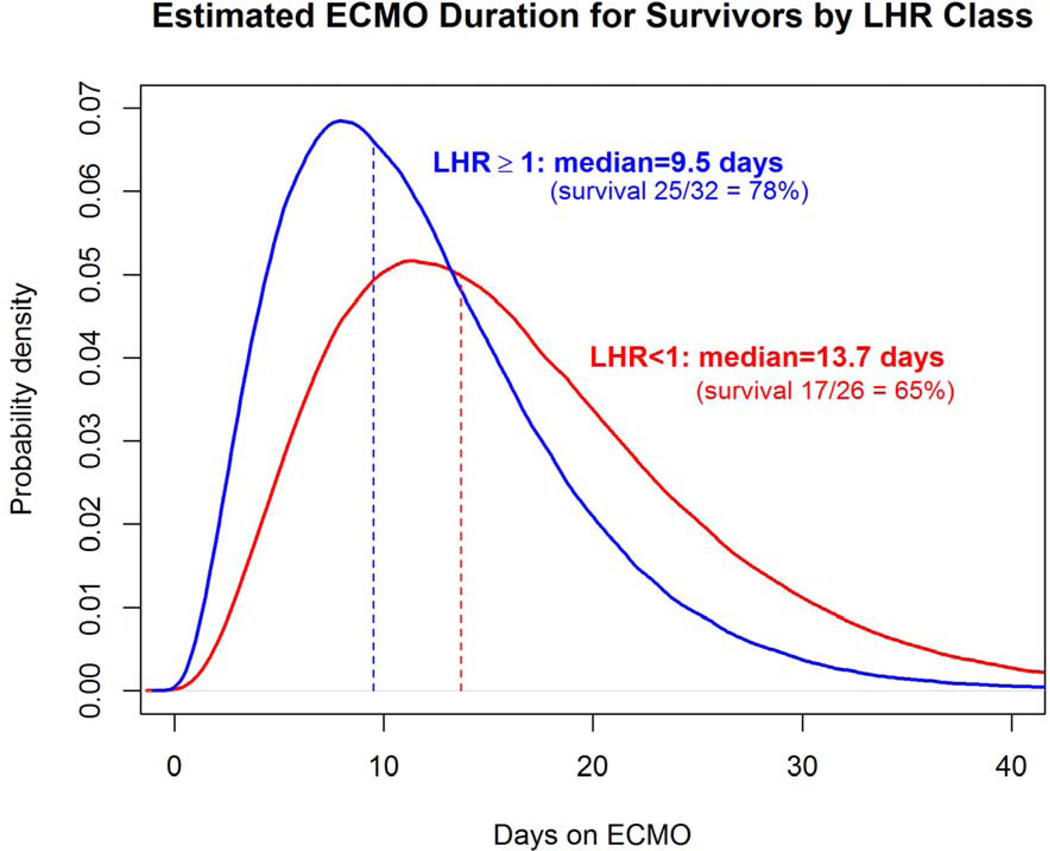
Figure 4.
a–c: Comparison of ECMO duration in survivors based on anatomy, CDH Predicted Survival, and LHR. (a); Distribution curve of estimate ECMO duration for patients with CDH anatomy of Left liver-down versus Left liver-up versus Right CDH.(p=0.448) (b): Predicted Survival: Distribution curve of estimated ECMO duration in patients with CDH Predicted Survival greater than 50% compared to less than or equal to 50% (p=0.006). (c): LHR: Distribution curve of Estimated ECMO duration for patients with LHR greater than or equal to 1 versus less than 1. (p=0.012) All curves based on data in this series.


