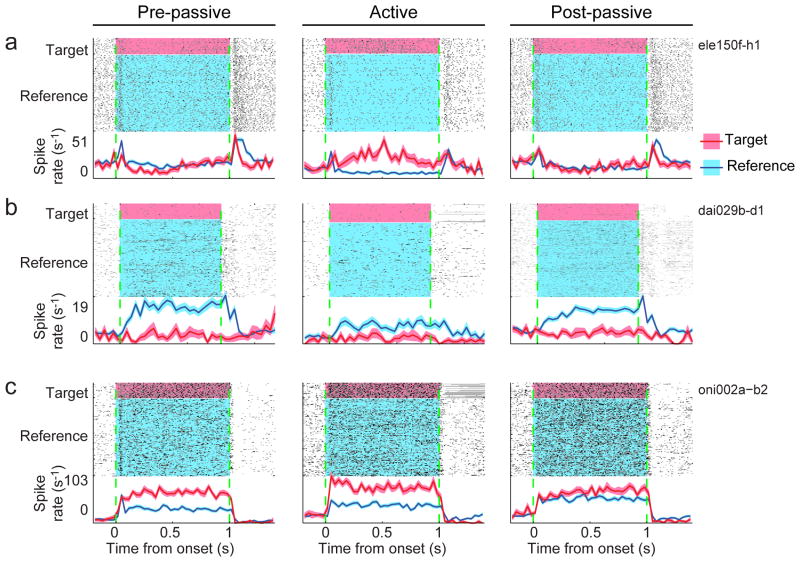
Figure 3.
Raster plot comparing target (red) and reference responses (blue) for three PEG neurons, before (left column, “pre-passive”), during (middle, “active”) and after behavior (right, “post-passive”). Dashed green lines indicate sound onset and offset. Curves below the rasters show the PSTH response averaged across all target or reference sounds and using 50 ms bins (shading indicates one standard error on the mean computed by jackknifing). Gray horizontal shading in rasters indicate incorrect trials where the artifact from the punishment period was removed. (a) In this example, the neuron gave a transient response to the target tone and a sustained response to the reference noise during passive listening. During behavior, the target response became sustained and increased in overall spike rate relative to the spontaneous baseline (77%) while the reference response decreased and became slightly suppressed after the initial transient (-15%). This resulted in an overall enhancement in the target response relative to the reference response. (b) This neuron produced a positive sustained response to reference sounds but was slightly suppressed by targets during passive listening. During behavior, the target response increased slightly, but the reference response decreased substantially across the entire period of stimulation by about 40%. (c) For a third neuron, reference and target sounds produced a strong response during passive listening. During behavior, the target response increased (18%) while the reference response was slightly suppressed (-3%).

