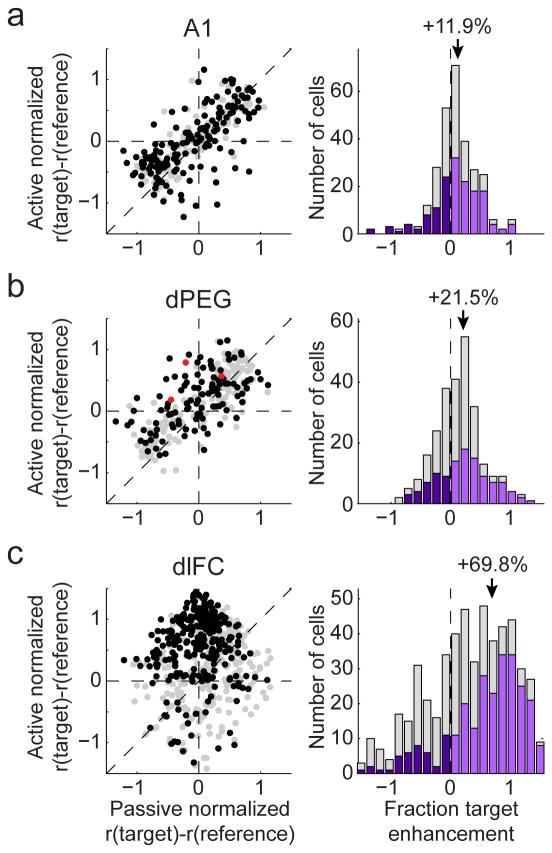
Figure 5.
(a) Average behavior-dependent change in reference and target responses in A1. Left panel compares the average target preference (i.e., target minus reference response) for each A1 neuron during passive listening (horizontal axis) and during behavior (vertical axis). Units that underwent significant changes in response during behavior are plotted in black (n=155/283, p<0.05, jackknifed t-test). Overlap of black and gray points reflects the fact that significance was tested by a z-score (i.e., change in mean firing rate normalized by the standard error on the mean) so that small absolute changes in firing rate can be significant if response variability is small. Right panel shows a histogram of the change in the relative target preference between passive and active conditions (i.e., distance from the diagonal in the left panel). Units with significant increases/decreases are plotted in light/dark purple. The average change in target preference during behavior in A1 was 11.9%, significantly greater than expected by chance (p<0.001, jackknifed t-test). (b) Task-dependent target versus reference changes in dPEG, plotted as in a (n=110/260 significantly modulated neurons). Together these changes lead to an overall average change in target preference of 21.5% during behavior (p<0.001, jackknifed t-test). (c) Task-dependent target versus reference changes in dlFC (n=266/530 significantly modulated neurons). Neurons in this areas undergo a much larger change, averaging a +69.8% change in target preference, reflecting the strong target-selective response that appears only during behavior (p<0.001, jackknifed t-test).

