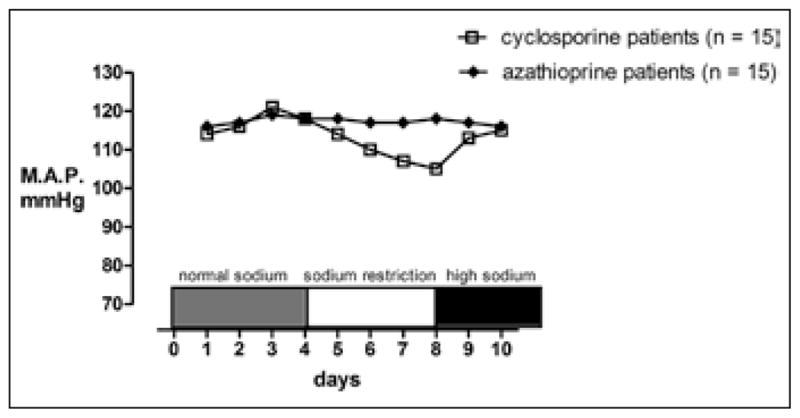
Fig. 2.

Mean arterial pressures (MAP) (average of 5 measurements each day for each patient) of the cyclosporine- and azathioprine-treated groups. Patients had similar MAP values on the control diet (150 mEq). With sodium restriction, the cyclosporine group had a significant (p<0.01) fall in blood pressure compared with either their baseline values or with the values of the azathioprine group, which did not decrease with sodium restriction. Adapted from (33) with permission from Elsevier.
