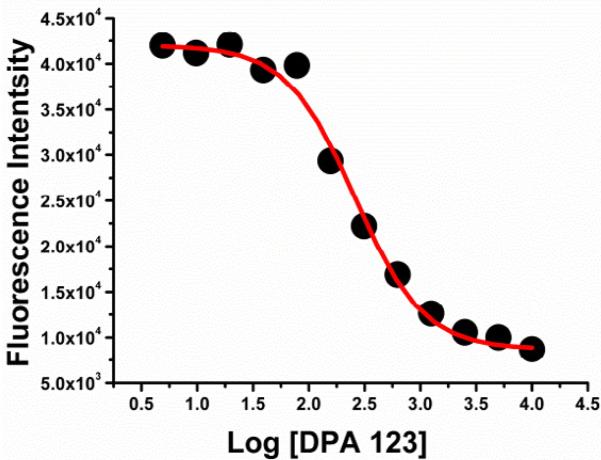
Figure 2.
A representative plot showing the decrease in the fluorescence of fluorescein labeled tat-TAR complex upon ligand (DPA 123) binding of tat-TAR RNA complex. A 1:1 mixture of tat peptide (100 nM) and TAR RNA (100 nm) were mixed in Tris buffer containing 50 mM Tris, 20 mM KCl at pH 7.4. The resulting complex was titrated with DPA 123 until no change in fluorescence was observed. The resulting binding isotherm was fitted with a dose response curve using Origin 5.0 (see supporting information for fitting details).

