
Figure 6. Angiogenic and vasculogenic mimicry.
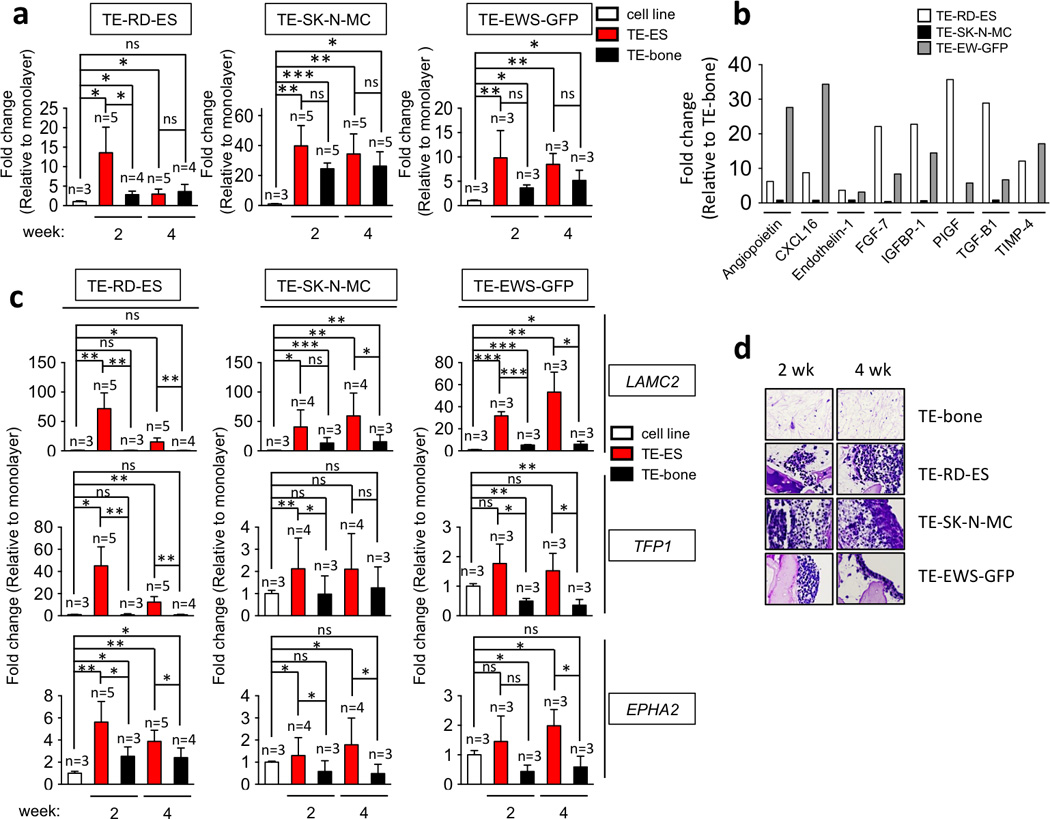
(a) VEGFα mRNA levels in TE-ES models. Fold change was calculated by first normalizing to actin levels in the individual samples and then to the corresponding levels in cells cultured in 2D. Data are shown as average ± SD (n=3–5). Two-tailed Student’s T-test was used to determine statistical significance. *p < 0.05; **p < 0.01, ***p < 0.001; ns, not significant. (b) Angiogenesis-related proteins in TE-ES culture media. Expression levels of the indicated proteins were assessed by ELISA and compared with expression levels in the TE-bone counterparts. (c) qRT-PCR analysis of vasculogenic mimicry markers. Relative endogenous expression of each gene was normalized to actin and the fold change was obtained normalizing to the levels in corresponding cell lines cultured in 2D. Data are shown as average ± SD (n=3–5). Statistical significance was determined by the two-tailed Student’s T test. *p < 0.05; **p < 0.01, ***p < 0.001; ns, not significant. (d) Representative images of PAS-stained sections from TE-bone and TE-ES models at week 2 and 4. Representative images are shown (n=3).