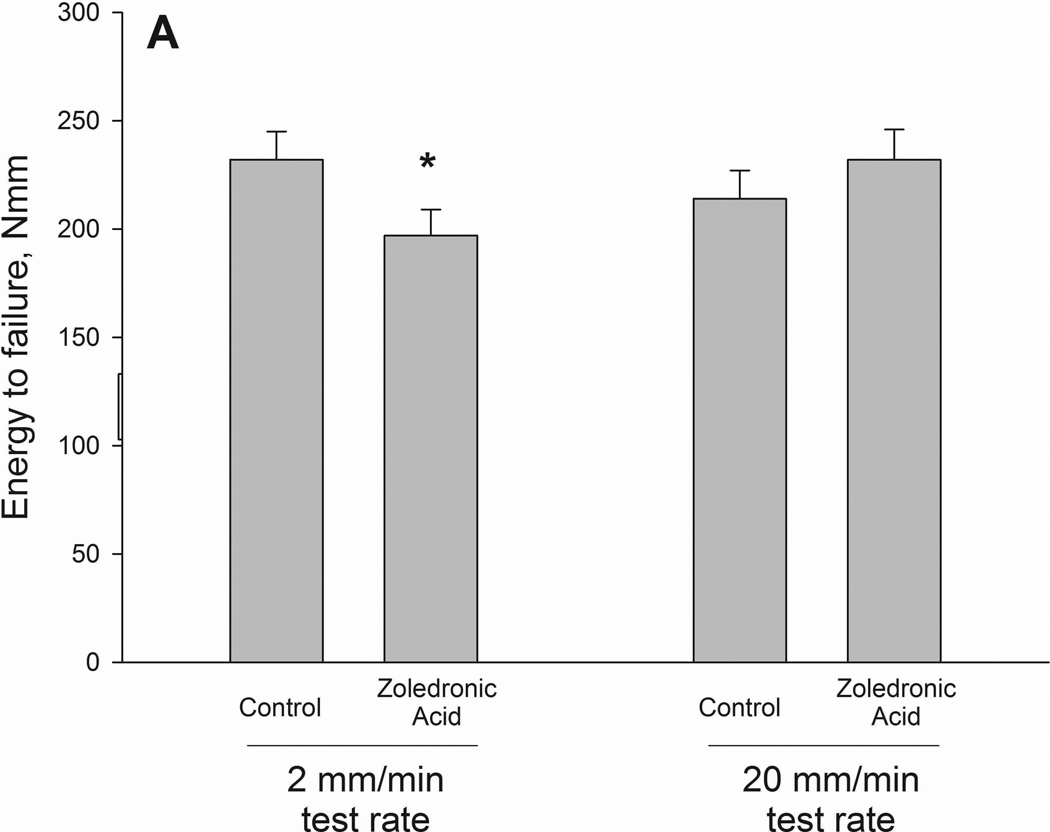
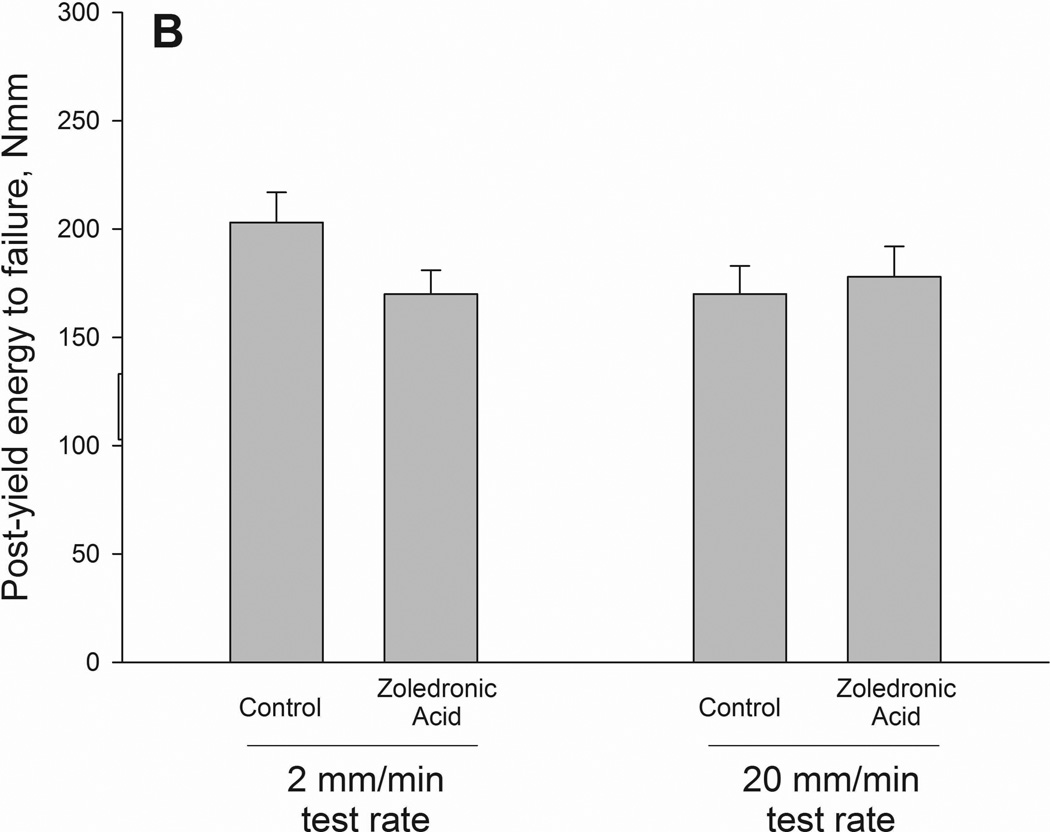
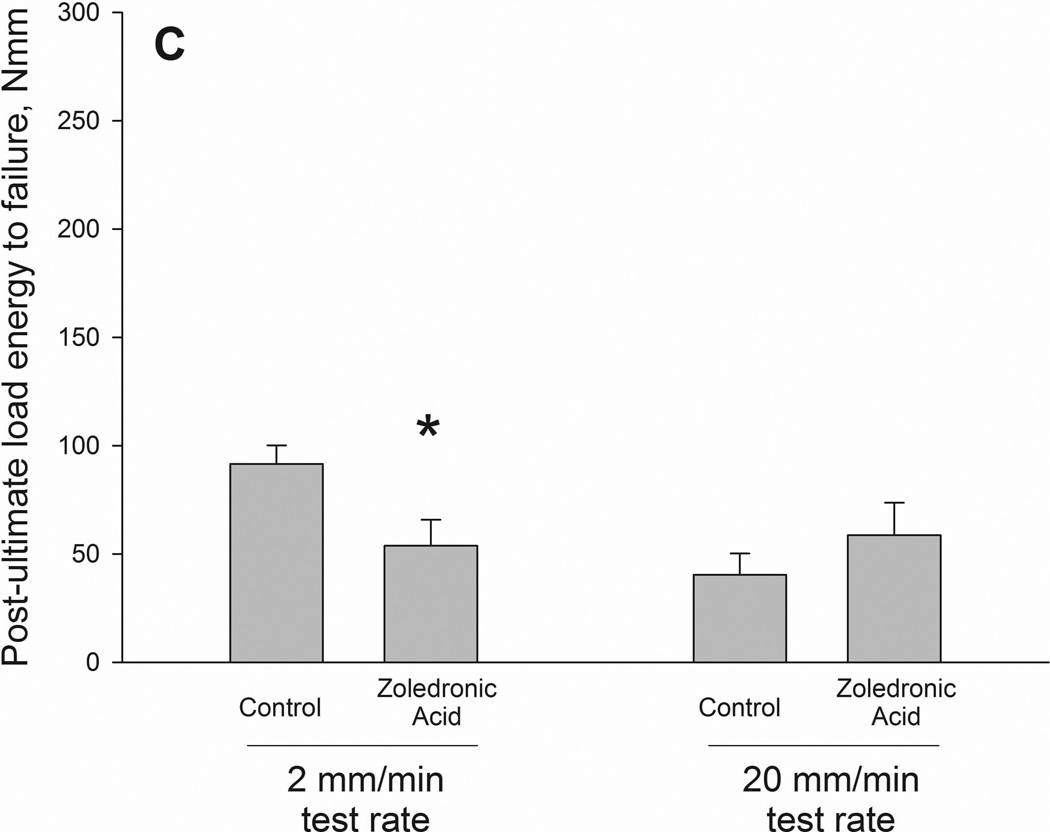
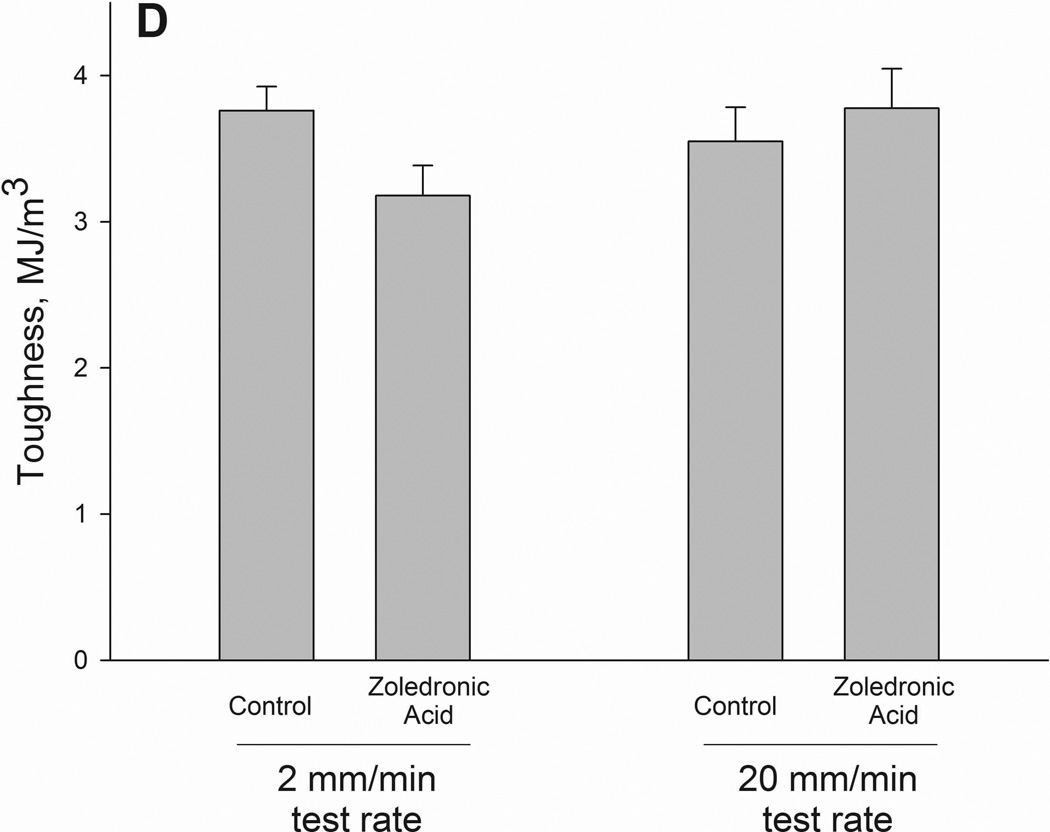
Figure 2.
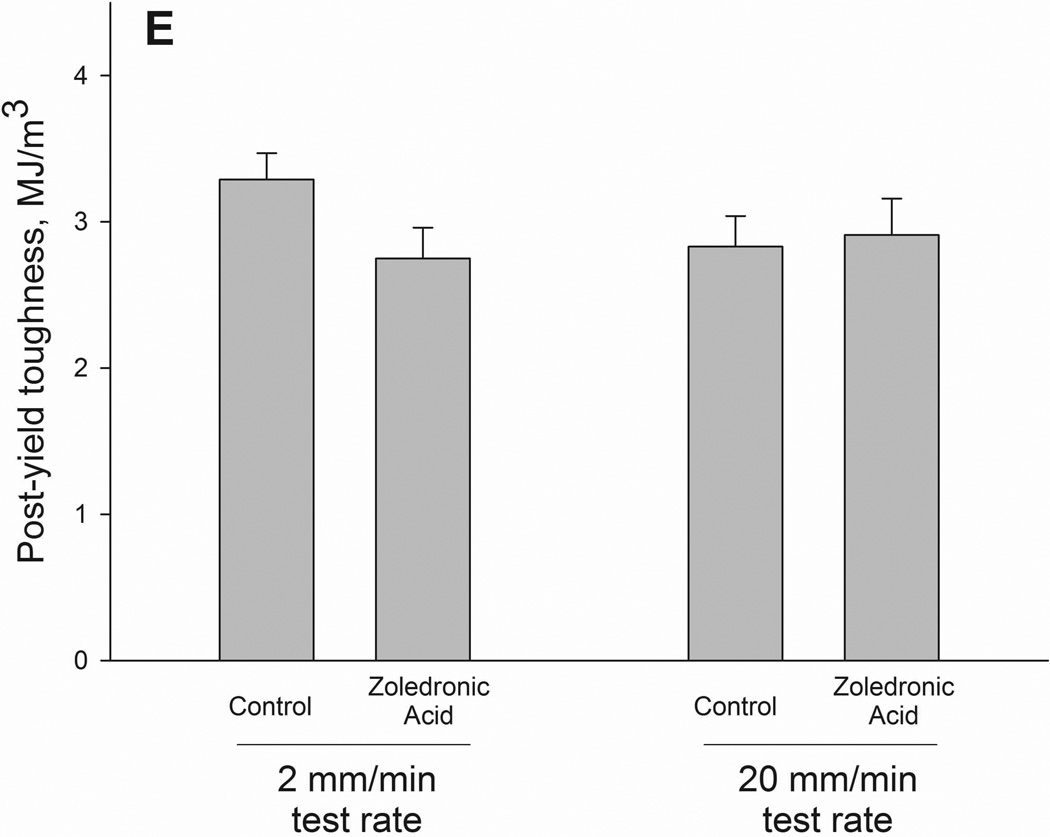
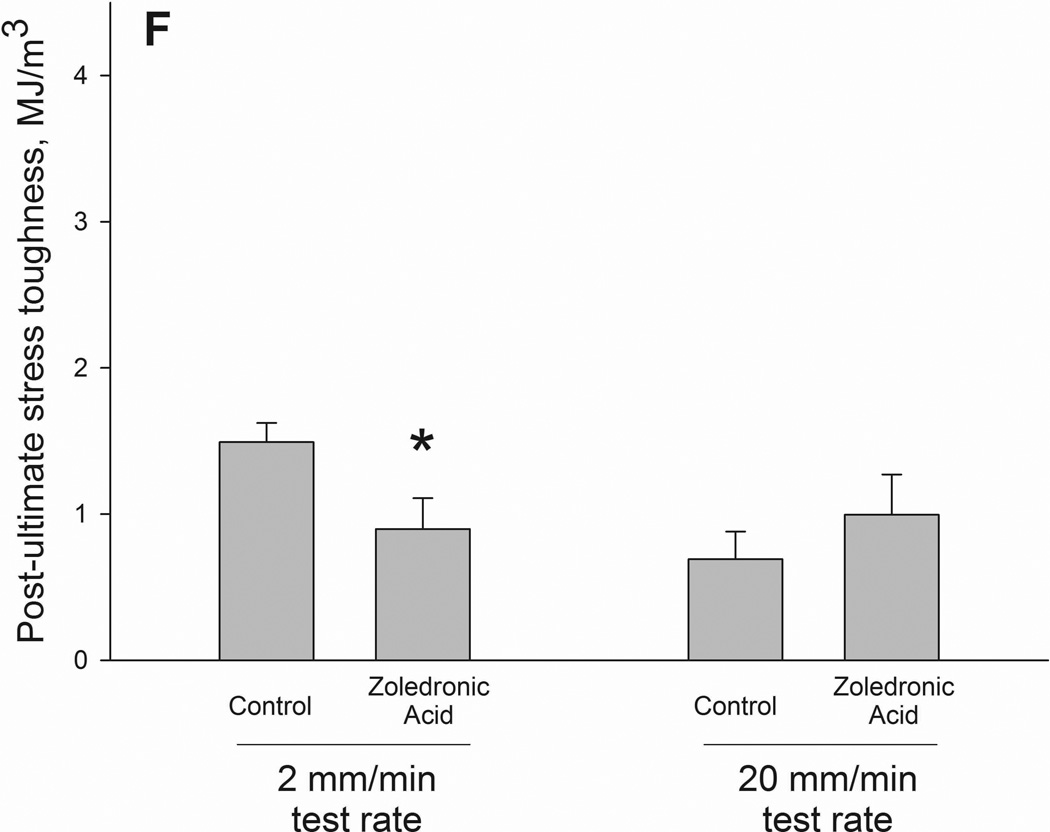
Structural (A–C) and material (D–F) energy absorption properties as determined by three-point bending tests. Whole bone energy absorption to fracture (A) and energy absorption between ultimate load and fracture (C) both displayed significant drug × test rate interaction with ZOL-treated animals having lower values only at the slow test rate (noted by *). Post-yield energy absorption (B) displayed a similar pattern but the effect was not statistically significant (2-way ANOVA p values < 0.15). When normalized for bone geometry to calculate toughness, patterns similar to those of the structure were observed. Only toughness from ultimate stress to fracture was significant (*) while both toughness to fracture (D) and post-yield toughness (E) showed consistent trends (2-way ANOVA p values < 0.15).

