
Fig. 2.
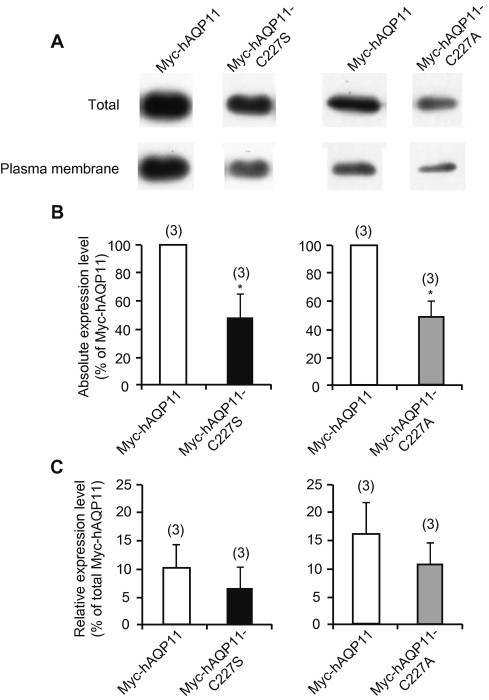
Cell surface expression level of AQP11 mutants at Cys227. (A) Cell surface expression levels of Myc-AQP11, Myc-hAQP11-C227S, and Myc-hAQP11-C227A were assessed by a biotinylation experiment. CHO cells were transfected with Myc-AQP11 or its mutant protein expression plasmid, and 24 h after transfection the cell surface proteins were labeled with membrane-impermeable biotin. The biotin-labeled proteins were precipitated by NeutrAvidin beads. The biotin-labeled cell surface proteins, as well as the total cell lysates, were analyzed by Western blotting using anti-Myc antibody. The Western blot image is separately shown, because the original image included data for the other sample in the middle lane between the Myc-hAQP11 and Myc-hAQP11-C227S, or Myc-hAQP11-C227A samples. The separate image originated from the same blot, while retaining the original quality. (B) The absolute cell surface expression level is summarized. Each value is expressed as a percentage of the mean value for Myc-hAQP11. Data are shown as means ± SE. The numbers of experiments are given in parentheses. ∗P < 0.05 compared with the Myc-hAQP11 group (Mann–Whitney U test). (C) The ratio of biotinylated to total Myc-tagged proteins was taken as an index of the relative surface expression level. Values are presented as mean ± SE. No significant difference was found between Myc-hAQP11 and Myc-hAQP11-C227S, or Myc-hAQP11-C227A (Student’s t test).