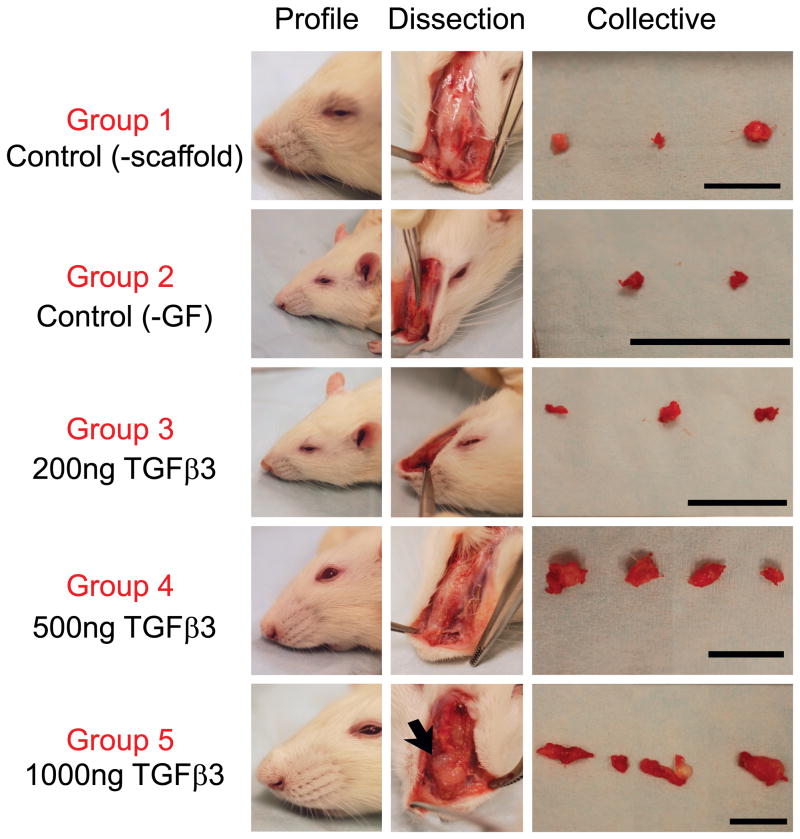
Figure 4.
Gross images of rhinoplasty harvests for groups 1–5. Profile images were taken immediately after harvest for visualization of remaining augmentation (A–F) and any ectopic tissue formation was dissected out (A′–F′). Harvested tissue from each rat in the experimental group was imaged together (A″–F″). Note: harvested tissue in D″, E″, and F″ consisted of two parts for some rats. Groups 1, 4 and 5: Scale = 1 cm. Groups 2 and 3: Scale = 1 inch

