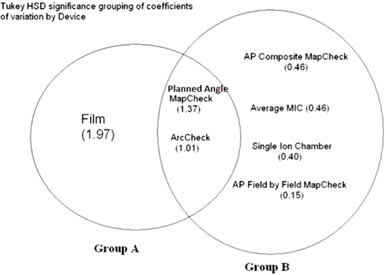
Figure 4.

Venn diagram showing statistically significant grouping of dosimetric systems based on their “total delivery” reproducibility. The coefficient of variation is given in parentheses. The coefficient of variation of film was significantly different from the cc04 ion chamber, MapCHECK with AP beams formed into a composite plane, MapCHECK with AP beams analyzed in a field‐by‐field analysis, and the multiple ion chamber (MIC) phantom. The coefficient of variation of the ArcCHECK and the MapCHECK with the original rotational gantry angles were not significantly different from either group.
