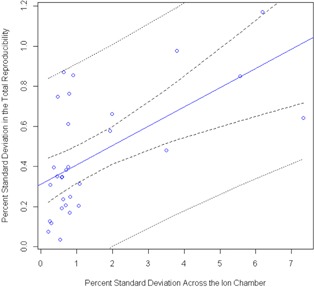
Figure 5.

Regression performed to determine the ability to predict “total delivery” reproducibility, given a known percent standard deviation in dose across the multiple ion chamber (MIC) phantom ion chamber from the TPS. The inner pair of dotted lines is the 95% confidence interval in the linear fit, whereas the outer pair of lines is the 95% prediction confidence interval. This regression analysis failed to find a strong relationship between the standard deviation in dose across the ion chamber ROI and the reproducibility in the measurement; however, it is interesting to note that even at low‐dose gradients, there is the possibility for large variation in the IMRT QA measurement.
