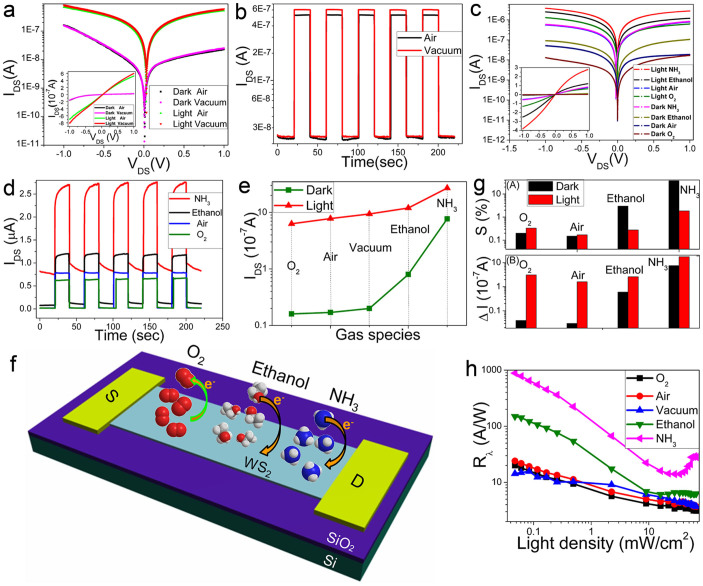
Figure 4. Gas sensing and its effect on photoresponse.
(a) IDS-VDS characteristics (on a log scale of y-axis) of the WS2 nanoflakes photodetectors under dark or in the presence of light (633 nm, 30 mW/cm2) measured in air and in vacuum. The insert is corresponding curve on a linear scale of y axis. (b) Time-dependent photocurrent response under air and vacuum during the light switching on/off. (c) IDS-VDS characteristics (on a log scale of y-axis) of the device under dark or in the presence of light (633 nm, 40 mW/cm2) measured in various gas atmospheres. The inset is corresponding curves on a linear scale of y axis. (d) Time-dependent photocurrent response under various gas atmospheres. (e) The extracted dark current and photocurrent under different gas atmospheres. (f) Schematic diagram of charge transfer process between adsorbed gas molecules and the multilayer WS2 nanoflakes transistor. (g) The gas sensitivity (A) (defined as S = |(Igas − Ivacuum)/Ivacuum|) and current change (B) (defined as ΔI = |Igas − Ivacuum|) under different conditions. (h) The photo-responsivity Rλ under various gas atmospheres, showing high sensitivity. The device exhibits a maximum Rλ of 884 A/W with low light density of 50 μW/cm2.

