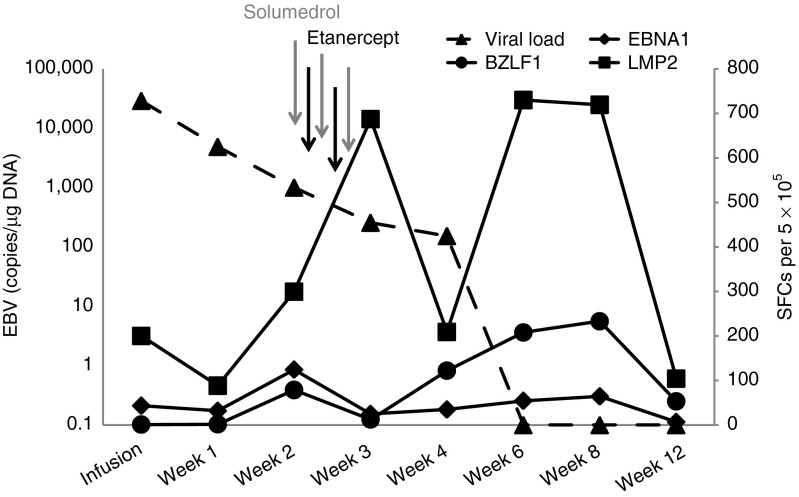
Figure 4.
Immune response to EBV. This graph shows the EBV load (dotted line) on the day of infusion as well as the precursor frequency of T cells directed against the EBV antigens targeted in the infused T-cell line—EBNA1, LMP2, and BZLF1—before and after infusion. The time points at which etanercept and solumedrol were administered are also indicated. EBNA1, Epstein-Barr virus nuclear antigen 1; EBV, Epstein-Barr virus; LMP2, latent membrane protein 2.

