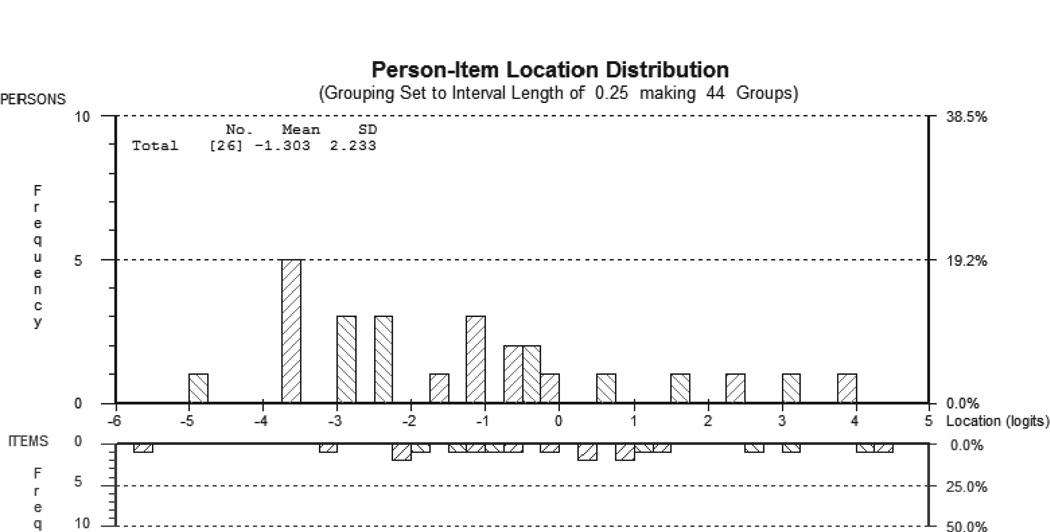
Fig. 2.
With reference to the AMAT-9, the figure depicts the person-item locations with the distribution of persons in the top half of the graph and items in the bottom half. The two distributions are separated by the logit scale. The distribution was calculated for 20 items and 32 persons, with 6 subjects excluded due to extreme scores (all positioned to the far left of the distribution). SD: standard deviation.

