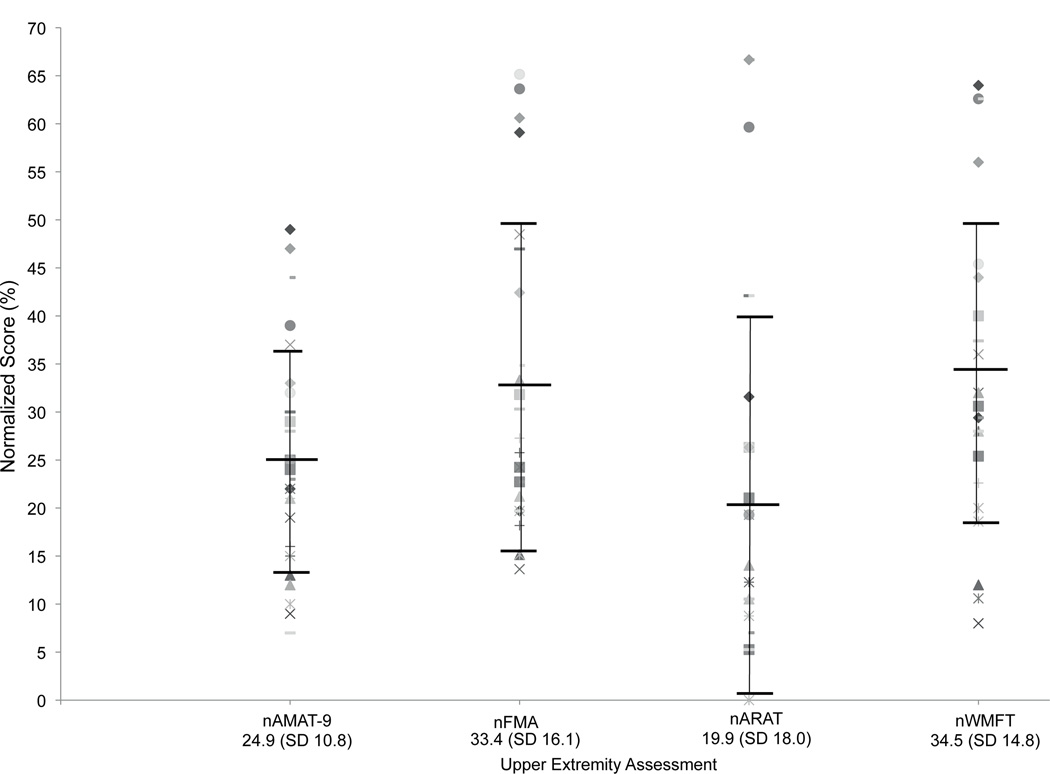
Fig. 3.
A scatter plot of normalized scores (raw score/total score × 100) for the 4 upper extremity assessment scales used in this study. All scores range from 0–100. The mean normalized score with standard deviation (SD) in parentheses appears below the scale name at the bottom of the figure. normalized AMAT-9 scores are grouped somewhat more tightly than other measures, with ARAT scores grouping in the lower range of the scale. Similar distributions are noted between normalized WMFT and FMA scores. %: percent of total score; nAMAT-9: normalized Arm Motor Ability Test (9 item version): nFMA: normalized Fugl-Meyer Assessment; nARAT: normalized Arm research Action Test; nWMFT: normalized Wolf Motor Function Test.

