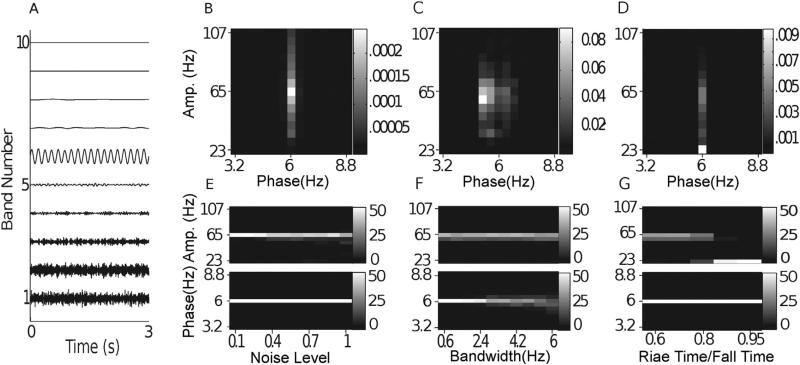
Fig. 15.
Misalignment between filter bank and signal. (A) Decomposition resulting from applying a near-dyadic filter bank to the sample signal containing white noise with variance 0.5 appearing in Fig. 3C. (B) Comodulogram resulting from applying this filter bank to 50 realizations of a signal having noise level 0.5. (C) Comodulogram resulting from applying this filter bank to 50 realizations of a signal having a nonstationary phase-giving oscillation with bandwidth 65 Hz. (D) Comodulogram resulting from applying this filter bank to 50 realizations of a signal having an asymmetric phase-giving oscillation with a 95 data point rising phase. (E-G) Corresponding histograms for these challenges, obtained using a near-dyadic filter bank.

