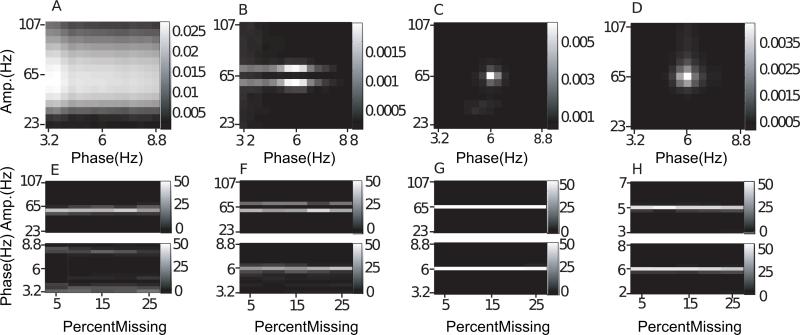
Fig. 6.
Missing data. In (A–D), we show the average comodulogram obtained from each method, for 50 realizations with 25% missing data: (A) BPAC1; (B) BPAC2; (C) DFPAC; and (D) IMPAC. In (E–H), we show histograms of the phase and amplitude frequency bins at which the maximum PAC is observed, for all methods and all simulated percentages of missing data, in the same order.

