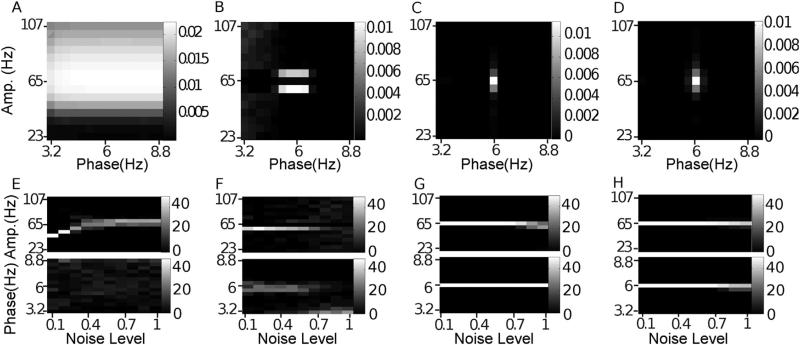
Fig. 8.
Low amplitude amplitude-giving oscillations. In (A–D), we show the average comodulogram for 50 realizations of a standard signal with added white noise of variance 0.5, transformed so that the amplitude of each Fourier component is proportional to its frequency, obtained with: (A) BPAC1; (B) BPAC2; (C) DFPAC; and (D) IMPAC. In (E–H), we show histograms of the phase and amplitude frequency bins at which the maximum PAC is observed, for all noise levels, and for all methods.

