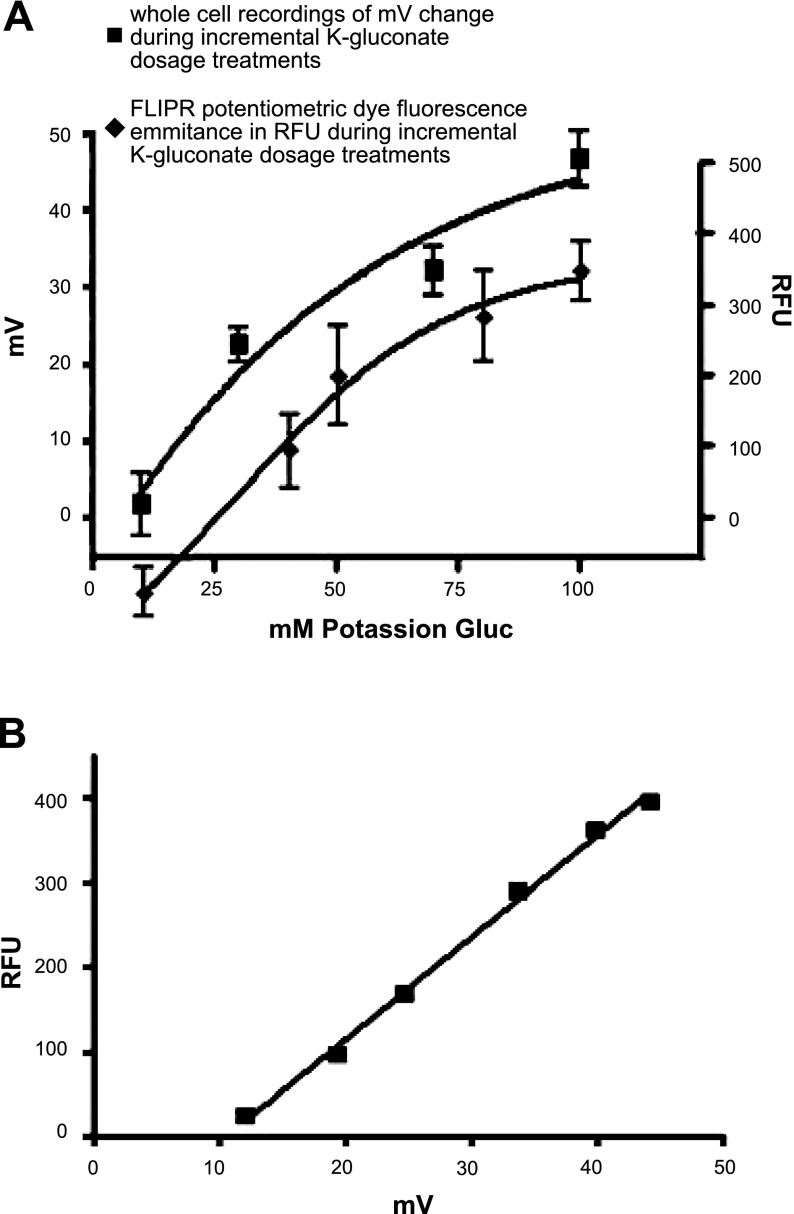
Figure 5.
Quantification of glycine-induced plasma membrane potential (mV) changes in cultured airway smooth muscle cells in relation to FLIPR emission fluorescence. A) Dose response to K gluconate, measuring either fluorescence [relative flurorescence units (RFU); bottom curve, right axis] or membrane potential (top curve, left axis) in cultured airway smooth muscle cells. Fluorescence was measured by potentiometric FLIPR dye, and membrane potential was measured by electrophysiological whole-cell recordings. Curves were approximated using a Boltzmann nonlinear regression curve fit. B) Linear regression of matched data points from panel A Boltzmann curves, correlating membrane potential change to fluorescence change.

