
Figure 2.
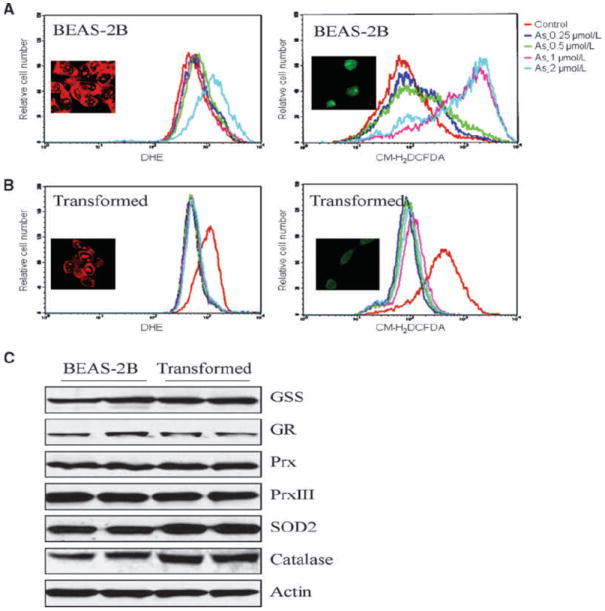
As3+ induces ROS generation in BEAS-2B cells but not in the transformed cells. A, generation of O2•− (left) and H2O2 (right) was determined in the nontransformed cells (BEAS-2B) by staining the cells with DHE and CM-H2DCFDA, respectively, followed by flow cytometry. B, generation of O2•− (left) and H2O2 (right) was determined in the transformed cells by staining the cells with DHE and CM-H2DCFDA, respectively, followed by flow cytometry. Insets in A and B are images obtained by immunofluorescence staining and fluorescence microscopic analyses for the generation of O2•− and H2O2, respectively. C, transformed cells show increased expression of SOD2 and catalase. GR, glutathione reductase.