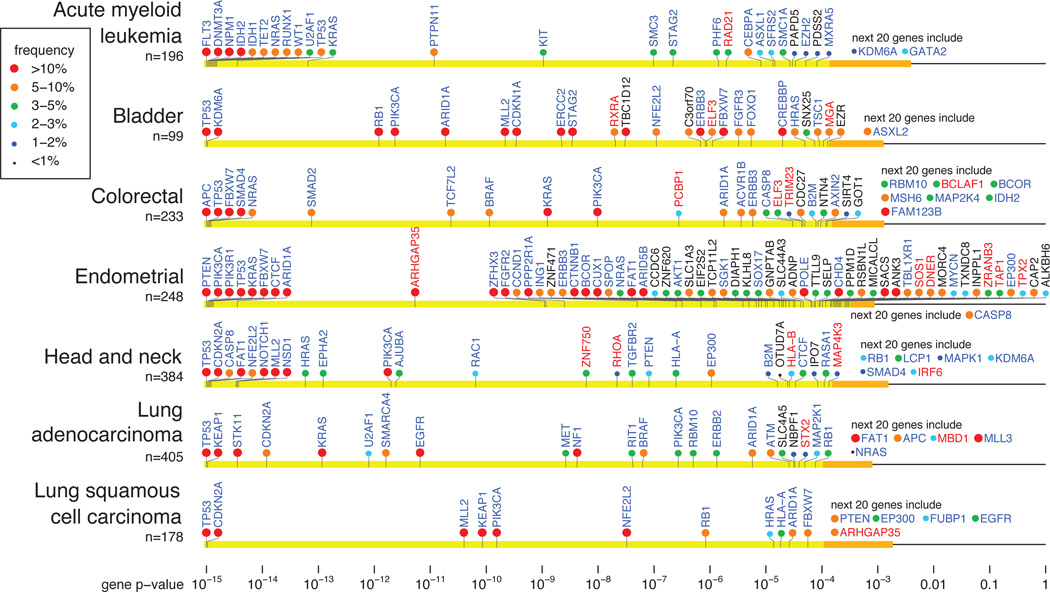
Figure 2.
Cancer genes in selected tumor types. Genes are arranged on the horizontal line according to p-value (combined value for the three tests in MutSig). Yellow region contains genes that achieve FDR q≤0.1. Orange interval contains p-values for the next 20 genes. Gene name color indicates whether the gene is a known cancer gene (blue), a novel gene with clear connection to cancer (red; discussed in text), or an additional novel gene (black). Circle color indicates the frequency (percent of patients carrying non-silent somatic mutations) in that tumor type. See also Supplementary Figure 5.

