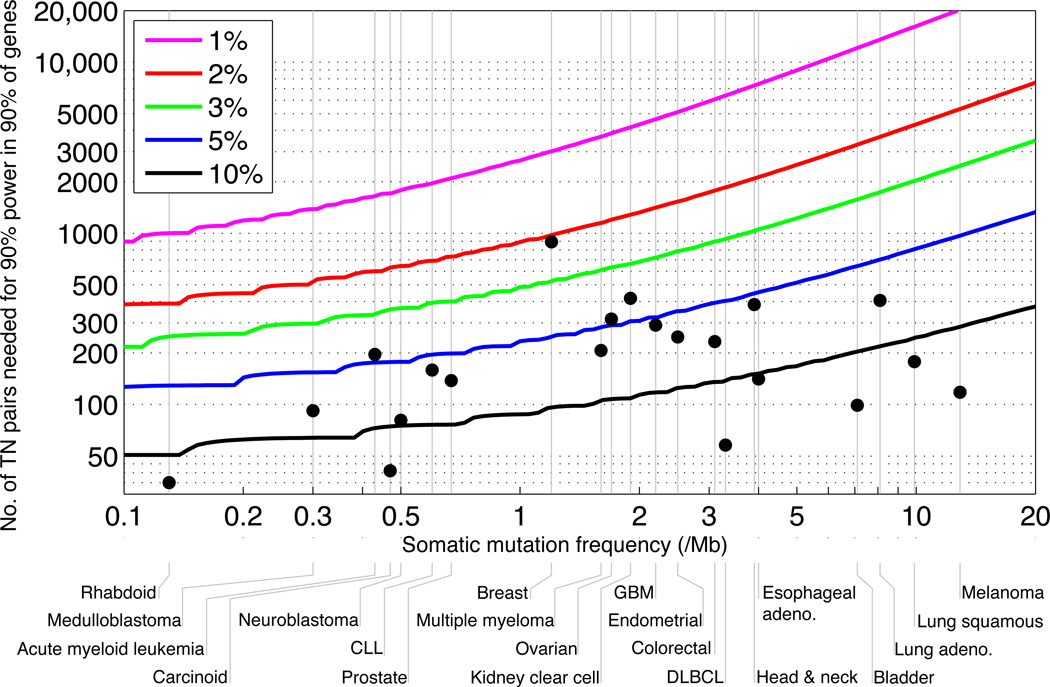
Figure 5.
Number of samples needed to detect significantly mutated genes, as a function of a tumor type’s median background mutation frequency of (x-axis) and a cancer gene’s mutation rate above background (the various curves). Y-axis shows the number of samples needed to achieve 90% power for 90% of genes. Grey vertical lines indicate tumor type median background mutation frequencies. Black dots indicate sample sizes in the current study. For most tumor types, the current sample size is inadequate to reliably detect genes mutated at 5% or less above background. See also Supplementary Figure 9.

