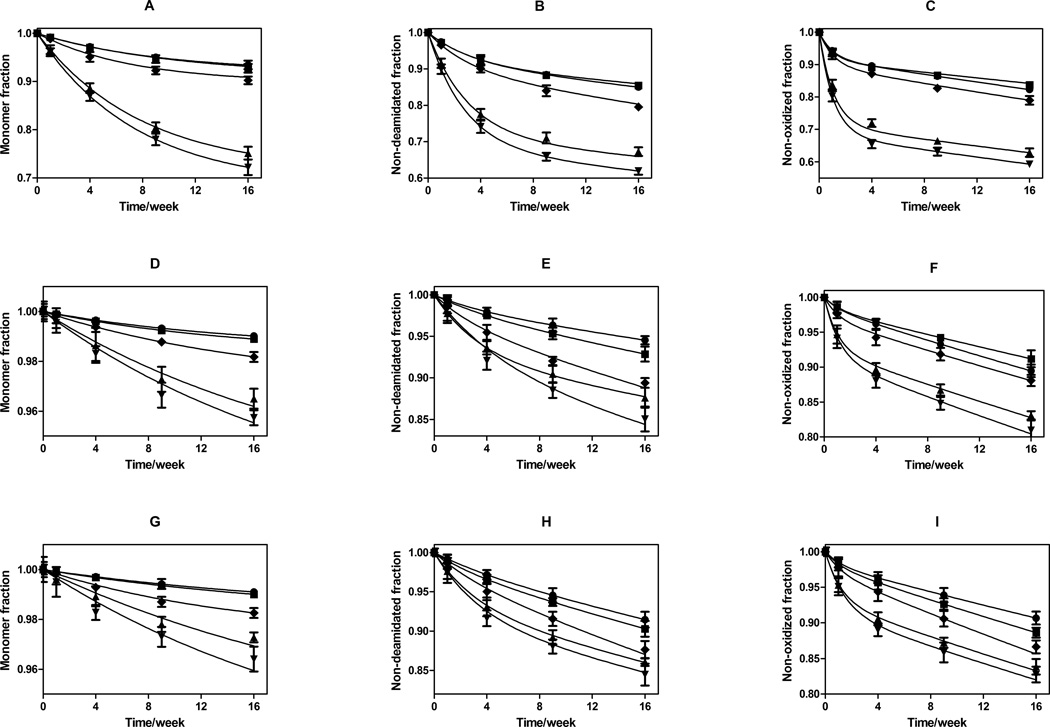
Figure 4.
Storage stability as a function of incubation time at 323 K for rhGH in formulations lyophilized using various cycle parameters. Panels: A) fraction monomeric rhGH remaining after storage in glassy HES; B) fraction rhGH not deamidated after storage in glassy HES; C) fraction rhGH that is not oxidized after storage in glassy HES; D) fraction monomeric rhGH remaining after storage in glassy trehalose; E) fraction rhGH not deamidated after storage in glassy trehalose; F) fraction rhGH that is not oxidized after storage in glassy trehalose; G) fraction monomeric rhGH remaining after storage in glassy sucrose; H) fraction rhGH not deamidated after storage in glassy sucrose; I) fraction rhGH that is not oxidized after storage in glassy sucrose. For all panels, lyophilization cycle conditions are represented by ♦: standard lyophilization, ●: pre-drying annealing, ■: post-drying annealing, ▲: N2-immersion, ▼: N2-droplet-freezing. Panel A–C represents HES formulation, Panel D–F represents trehalose formulation, and panel G–I represents sucrose formulation. Connected lines are predicted values from two parameter (ks and kb) first-order kinetics model for each individual formulation, using surface protein quantities determined from ESCA and SSA measurements.

