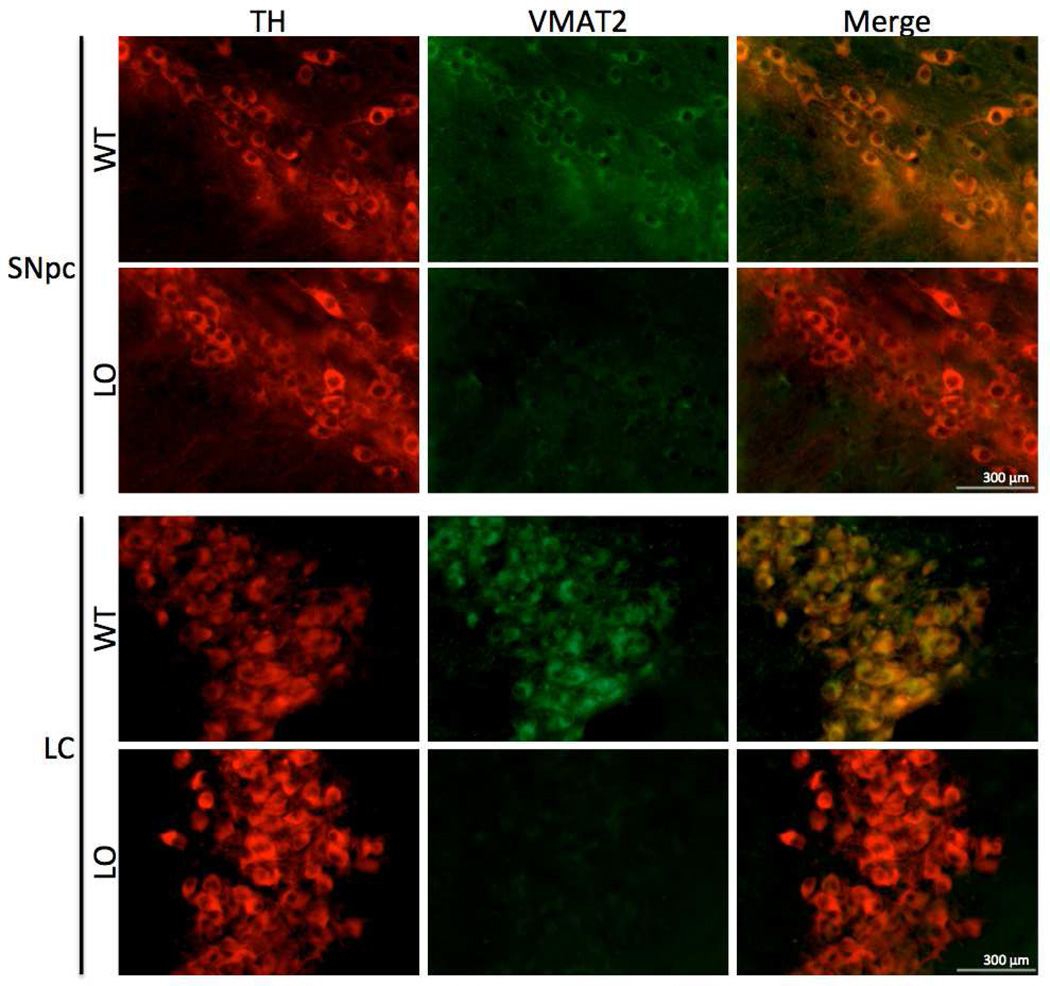
Figure 1. Immunohistochemical analysis of VMAT2 expression in the substantia nigra and locus ceruleus.
Widefield immunofluorescent images of TH and VMAT2 expression in the SNpc and LC. Top panels, WT mice exhibited normal TH (red) and VMAT2 (green) immunoreactivity in the SNpc, while VMAT2 LO mice had normal TH immunoreactivity, but trace somatic VMAT2 immunoreactivity. Lower panels, WT mice had marked TH and VMAT2 immunoreactivity in the LC, while VMAT2 LO mice exhibited normal TH immunoreactivity and trace VMAT2 immunoreactivity, as in the SNpc. Scale bars represent 300 µm.

