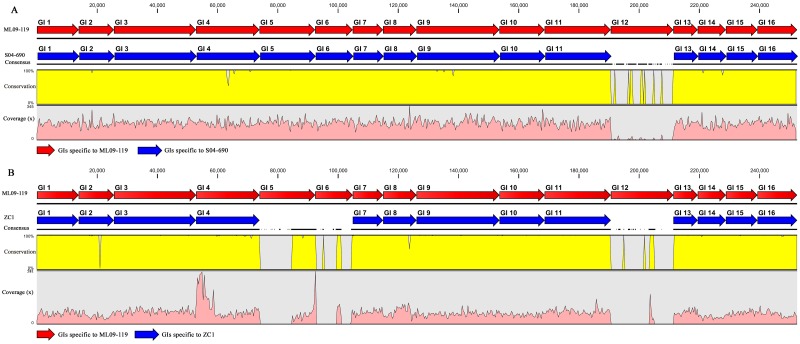
FIG 4 .
Reference alignment showing the maps of the orthologous genetic regions (blue arrow) of isolates S04-690 (A) and ZC1 (B) specific to the GIs of VAh isolates (red arrow). The scales for the percent conservation and average coverage of the Illumina sequences from both the isolates aligned with GIs of VAh isolates are shown on the left axis. The black horizontal line illustrates the continuous alignment of the sequences. and the discontinuous black line indicates the interruption of the sequence alignment.

