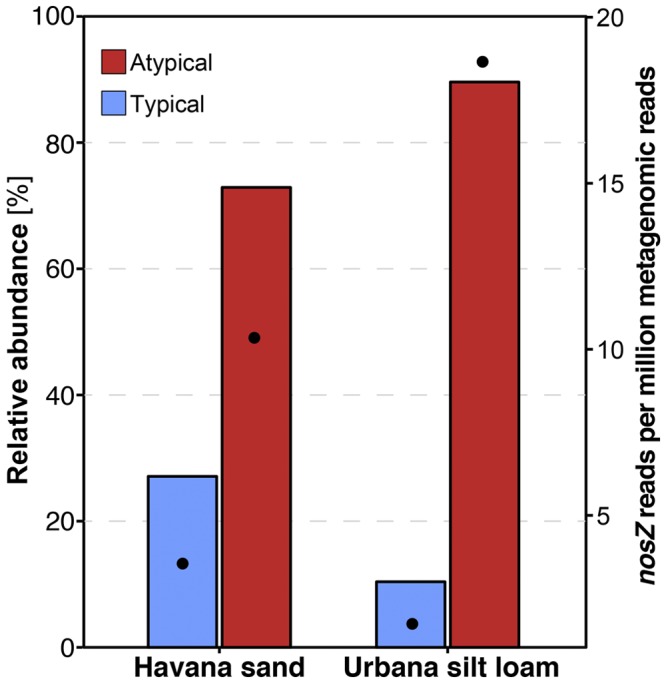
FIG 3 .

Relative abundances for typical and atypical nosZ genes in Havana sand and Urbana silt loam soil metagenomes. All metagenomic nosZ reads from soil were classified as typical or atypical according to their best match against a reference database of NosZ sequences, and the calculated relative abundances of the two gene types are shown (primary y axis, bars). The absolute abundance, i.e., number of identified nosZ reads per million of all reads in each metagenome is also shown (secondary y axis, dots).
