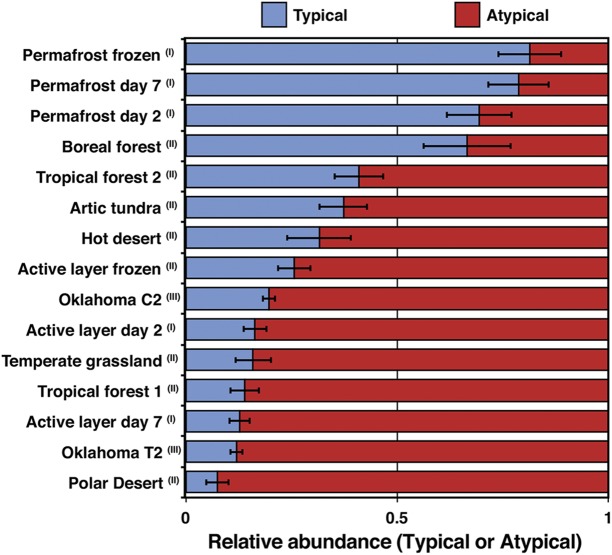
FIG 5 .
Relative abundances of typical and atypical nosZ sequences in various soil ecosystems. nosZ reads were retrieved from available Illumina short-read metagenomes by following the same approach used with the Illinois soils reported in this study. The bars represent the probability of finding typical (blue) or atypical (red) sequences as a proxy for their relative abundances, and the error bars represent the variance of the sample mean for each soil metagenome. Data sets were obtained from Mackelprang et al. (25) (library I), Fierer et al. (26) (library II), and Luo et al. (40) (library III).

