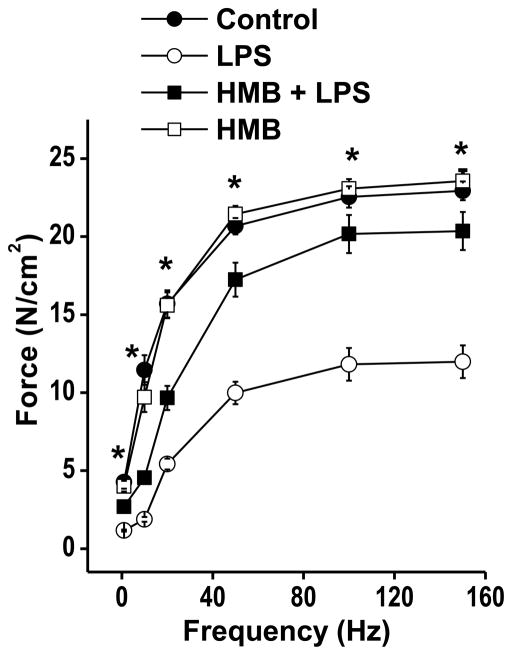
Figure 1.
This figure displays diaphragm specific force-frequency relationships for the four experimental groups of animals. Symbols represent mean forces and error bars indicate 1 standard error of the mean. Diaphragm specific force in the saline treated control group (solid circles) was significantly higher than force generated by the LPS treated animals (open circles) at all stimulation frequencies tested (* indicates a significant difference between the LPS group and the other three groups). Diaphragm specific force generation in animals given both HMB and LPS was similar to saline treated controls and significantly higher than that of the LPS treated group. Diaphragms from animals given only HMB generated specific forces similar to controls.

