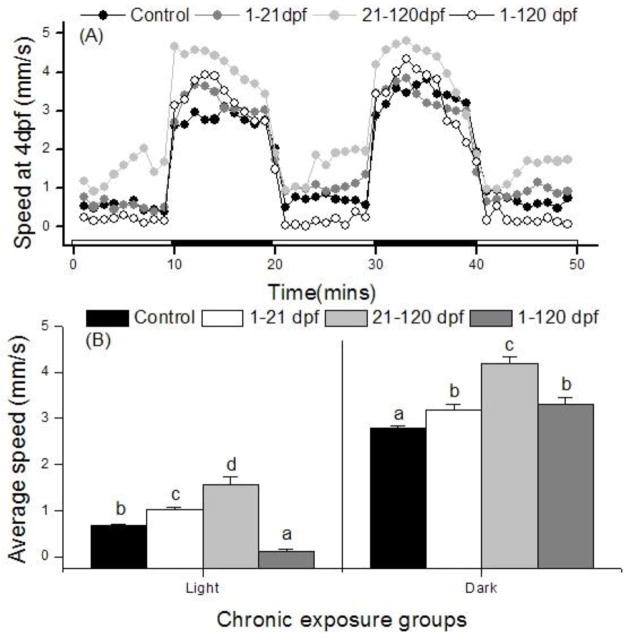
Fig. 4.
The locomotor activity of F1 larvae at 4 dpf when subjected to a 50-min dark-light photoperiod stimulation. Dots represent the mean speed in 60s intervals of 10 larvae (A). Treatments referred to parental 0.5μM PFOS exposure period. Average speed in light or dark period was shown (B). Bars of the same pattern sharing the same letter indicate no significant difference at P = 0.05 compared with control group.

