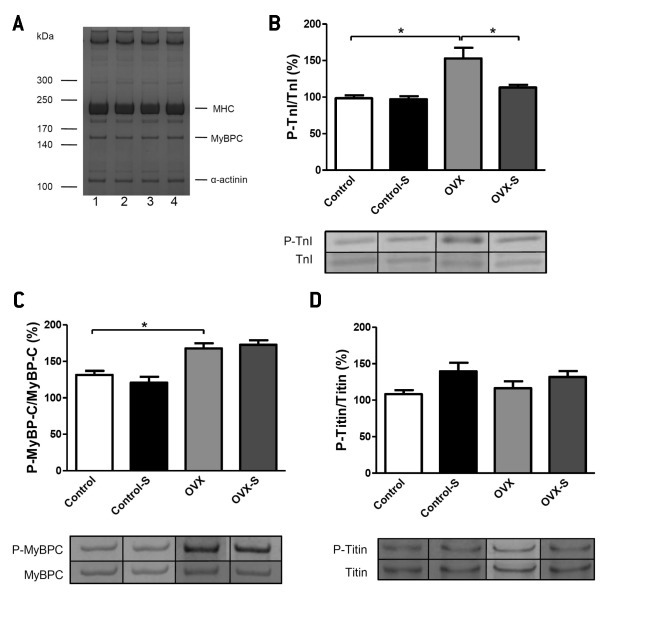
Figure 3.
Representative examples of myofilament protein composition and protein phosphorylation in the left ventricular (LV) myocardium from control and ovariectomized (OVX) rats. (A) Myofilament protein composition in LV tissue homogenate in control – 1, stressed control (control-S) – 2, ovariectomized (OVX) – 3, and stressed-OVX (OVX-S) animals – 4 (Coomassie blue protein staining, MHC – myosin heavy chain). (B) Increased overall troponin I phosphorylation (P-TnI) in OVX, but not in OVX-S group (*P < 0.05 vs control). (C) Elevated myosin binding protein-C phosphorylation (P-MyBP-C) in OVX and OVX-S rats (*P < 0.05 vs control). (D) Similar titin phosphorylation (P-titin) in the four experimental groups (Phosphorylation of myofilament proteins was normalized to the protein amount and expressed in percentages relative to an internal control).

