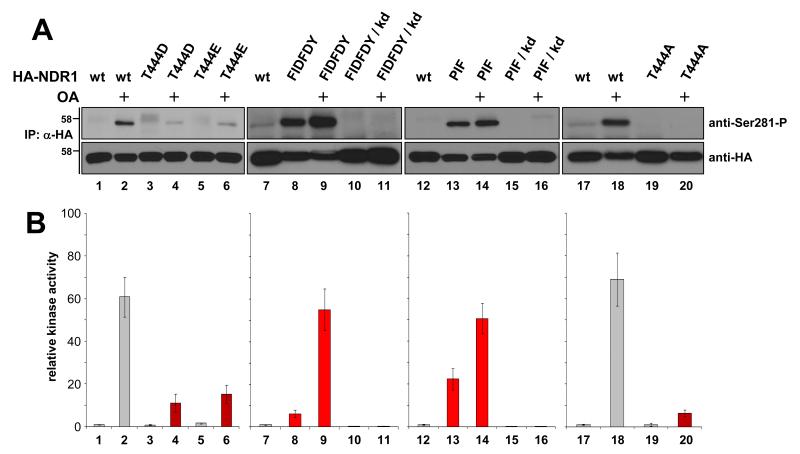
Figure 2. The NDR1(T444D) and NDR1(T444E) versions display impaired auto- and trans-phosphorylation activities.
(A) Lysates of Cos-7 cells expressing indicated HA-tagged NDR1 versions (wild-type, wt) were subjected to immunoprecipitation (IP) using anti-HA 12CA5 antibody. Complexes were analysed by Western blotting using anti-Ser281-P (top panel) and anti-HA antibody (bottom panel). Prior to lysis, the marked cells (+) were incubated with okadaic acid (OA). Molecular weights are shown. (B) In parallel, immunocomplexes were subjected to kinase assays. Cumulative data from three independent experiments with two replicates per experiment are shown. Error bars indicate standard deviations. The wild-type, FIDFDY and PIF versions of NDR1 displayed a 60-fold increase in kinase activities upon OA treatment. In contrast, NDR1(T444D), NDR1(T444E) and NDR1(T444A) were only activated 5- to 15-fold (about 75-90% decrease in activation when compared to NDR1(wt)).

