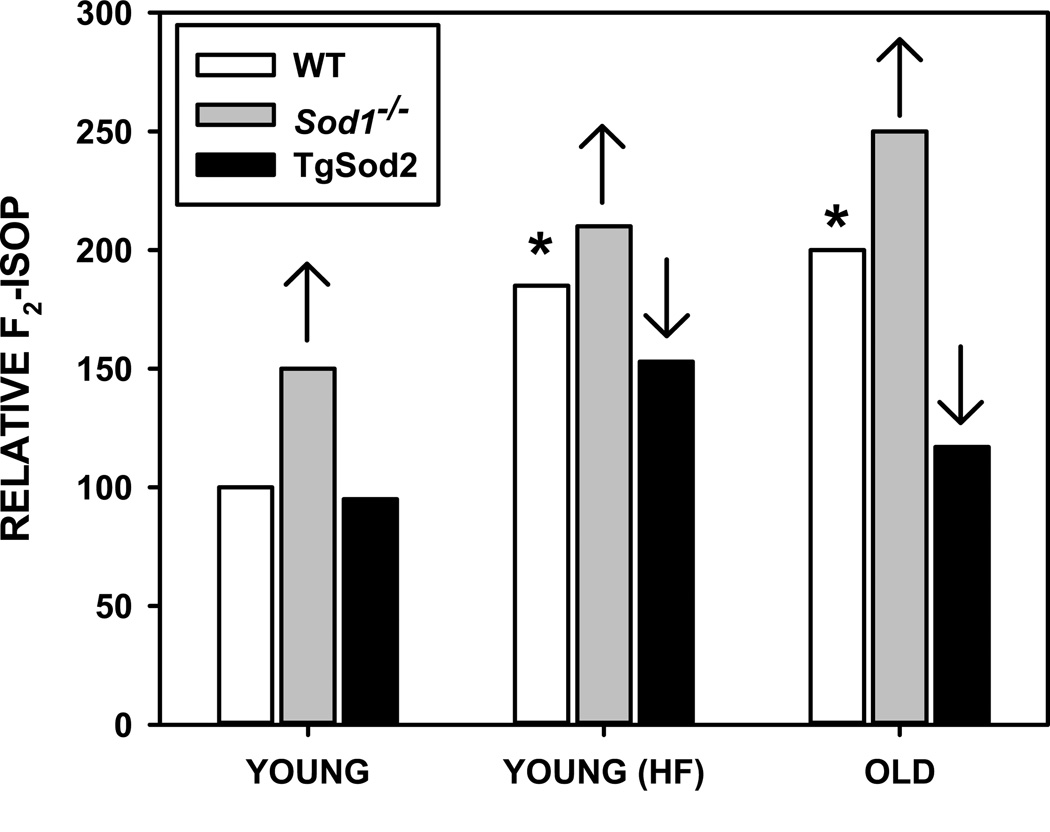
Figure 2.
Modulation of F2-isoprostane (F2-isop) levels in muscle by age, obesity, and genetic mutation of antioxidant enzymes. Data are presented as relative to levels measured in WT mice as reported in (48, 53, 80, 96). Asterisks represent F2-isop in WT increased significantly with either high fat diet or age. Up arrow represents significant increase in F2-isop in Sod1−/− mice compared to WT for indicated condition. Down arrow represents significant decrease in F2-isop in TgSod2 mice compared to WT for indicated condition.

