Fig. 3.
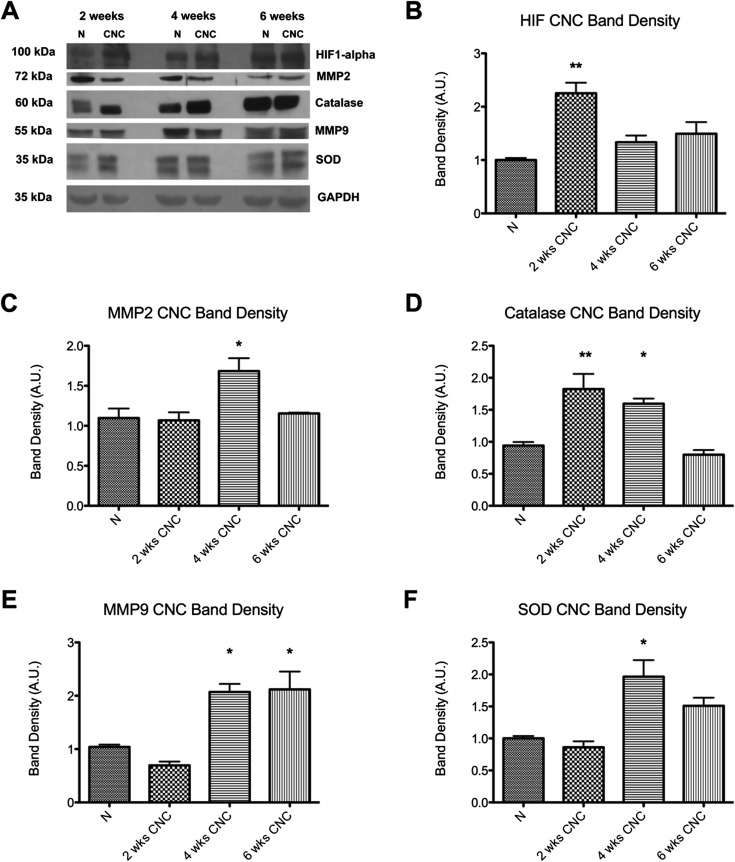
Figs. 3-A through 3-F Western blot analysis of normal, uninjured nerves (N) and nerves after two, four, and six weeks of chronic nerve compression (CNC) injury. The densitometry for the markers in Fig. 3-A is plotted in the remaining panels as the mean and standard error. *P < 0.05. **P < 0.01. A.U. = arbitrary units. Fig. 3-A Western blot bands for the cellular hypoxic markers and for the GAPDH reference. Fig. 3-B The HIF1α level was elevated early after CNC injury. Fig. 3-C The MMP2 level was elevated later after injury. Fig. 3-D The catalase level was elevated early after injury, and the elevation persisted longer than it did for HIF1α. Fig. 3-E The MMP9 level was elevated at four and six weeks after injury. Fig. 3-F The SOD level was elevated at four weeks after injury.

