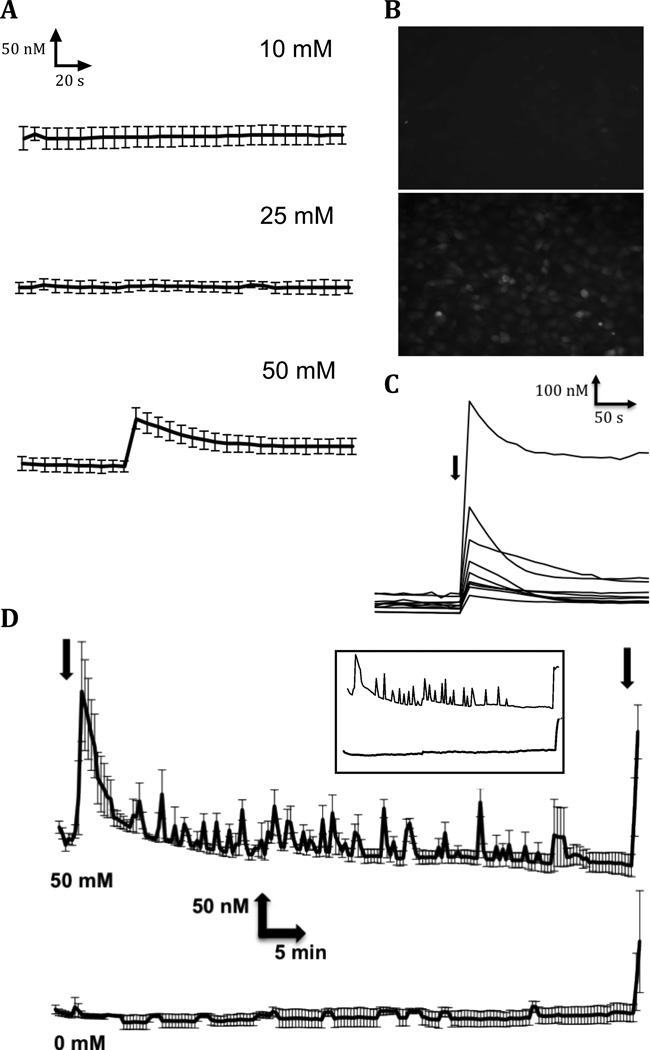
Figure 2. Effects of ethanol on intracellular Ca2+ concentration in HTR-8/SVneo human cytotrophoblast cells.
A. Ethanol at the indicated concentrations was added to fluo-4-loaded cells after 90 s while the intracellular Ca2+ concentration was monitored in real time at 10-s intervals. Average Ca2+ concentrations were calculated from confluent fields for a total of 5 minutes. Experiments were repeated three times and the averages with error bars indicating the SEM are shown. B. Examples of fluo-4 fluorescence 20 s after adding 0 mM (upper panel) or 50 mM (lower panel) ethanol to a field of cytotrophoblast cells. C. Individual cells were monitored for 5 min after exposure (arrow) to 50 mM ethanol. Intracellular Ca2+ concentration was monitored to illustrate the variability of Ca2+ transients among cytotrophoblast cells. D. Initial Ca2+ transients and subsequent smaller transients were observed when intracellular Ca2+ concentration was monitored for 1 h after cells were exposed (first arrow) to 50 mM or 0 mM ethanol, as indicated. Averages and SEMs are shown for three experiments. After 1 h, cells were exposed to 5 nM ionomycin (second arrow) to demonstrate that the fluorescent dye was still responsive to the intracellular Ca2+ concentration. Insert shows examples of individual cell tracings for 50 mM (upper) or 0 mM (lower) ethanol treatments.

