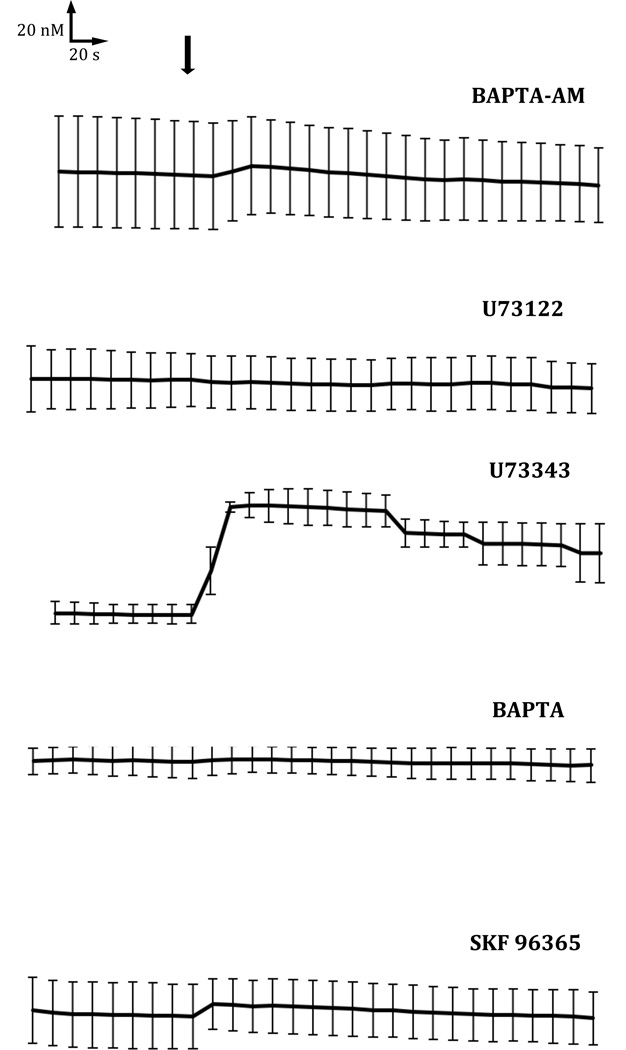
Figure 3. Source of ethanol-induced Ca2+ mobilization.
HTR-8/SVneo cells were treated with BAPTA-AM, U73122, U73343, BAPTA or SKF-96365, as indicated, and simultaneously loaded with 5 mM fluo4-AM for 30 min at 37°C. Cell fluorescence was monitored at 10 s intervals with addition of 50 mM ethanol after 90 s (arrow). Ca2+ levels were monitored for a total of 5 min. Experiments were repeated three times and the averages with error bars indicating the SEM are shown.

