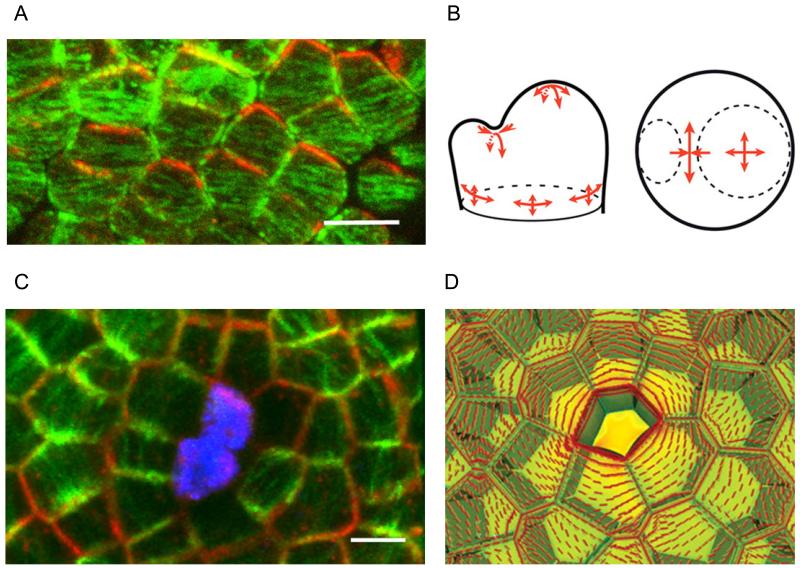
Figure 1. PIN1 polarity and MT orientations are co-aligned with mechanical stress patterns in boundary regions and around ablated cells in the SAM.
A. Double PIN1–microtubule immunosignal in the boundary domain: PIN1 (red) and microtubule (green) patterns are correlated. Scale bar = 5 μm (From Figure 1B in Heisler et al., 2010 [16]).
B. Stress pattern in different regions of SAM. Note that stress is strongly anisotropic (red arrows) in boundary region between primordium and SAM apex (From Figure 3B in Hamant et al., 2008 [7] Reprinted with permission from AAAS).
C. Co-alignment of PIN1-GFP (red) and microtubules (green) after ablation. Ablated cells are stained with propidium iodide (blue). Scale bar = 5 μm (From Figure 2C in Heisler et al., 2010 [16]).
D. Stress pattern around ablated site of SAM. Note that a circumferential stress pattern (red lines) is formed around the ablated site (From Figure 4A in Hamant et al., 2008 [7] Reprinted with permission from AAAS).

