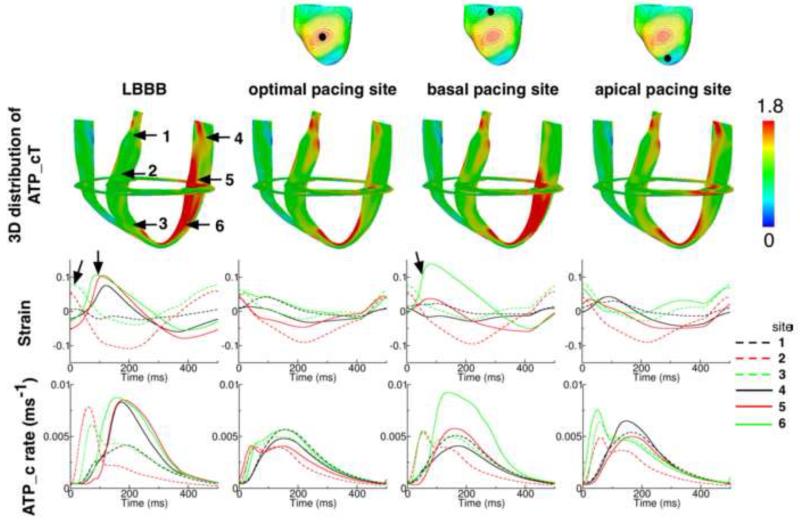
Figure 6.
1st row: Canine ventricles. The black dot indicates the location of the CRT epicardial site from which LV was paced. 2nd row: 3D distribution of ATP_cT in the DHF ventricles and the ventricles following CRT from the epicardial LV pacing sites shown in the 1st row. 3rd and 4th rows: Strain and ATP_c profile over one representative pacing cycle at six sites (marked by the arrows in the leftmost image in the 2nd row) from DHF ventricles and following CRT from the epicardial LV pacing sites shown in the 1st row.

