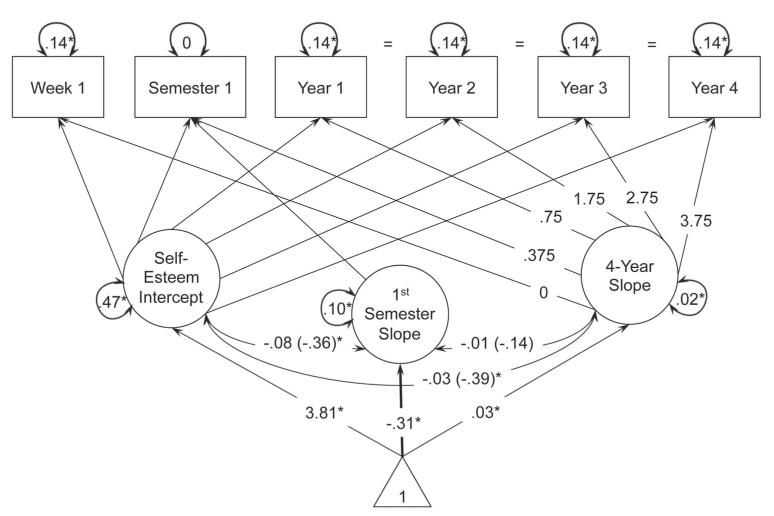
Figure 3.
Self-esteem trajectory (Model 0—no covariates). Because the Semester 1 assessment occurred about three and a half months after Week 1, the path from latent slope to Semester 1 was fixed at .375. The path from latent slope to the Year 1 assessment was fixed at .75 to represent another difference of three and a half months. Each subsequent assessment was collected yearly, and thus the path from latent slope to Year 2 assessment was fixed at 1.75; for the Year 3 assessment, fixed at 2.75; and for the Year 4 assessment, fixed at 3.75. Unstandardized estimates are presented in the figure. Standardized estimates are in parentheses. In a previous iteration of this model, the residual variance estimate of the Semester 1 assessment was negative, representing a Heywood case. However, the residual variance of the Semester 1 assessment was not significantly different from 0, and, consequently, the Semester 1 assessment was fixed at 0 to allow for more appropriate estimates. * p < .05.

