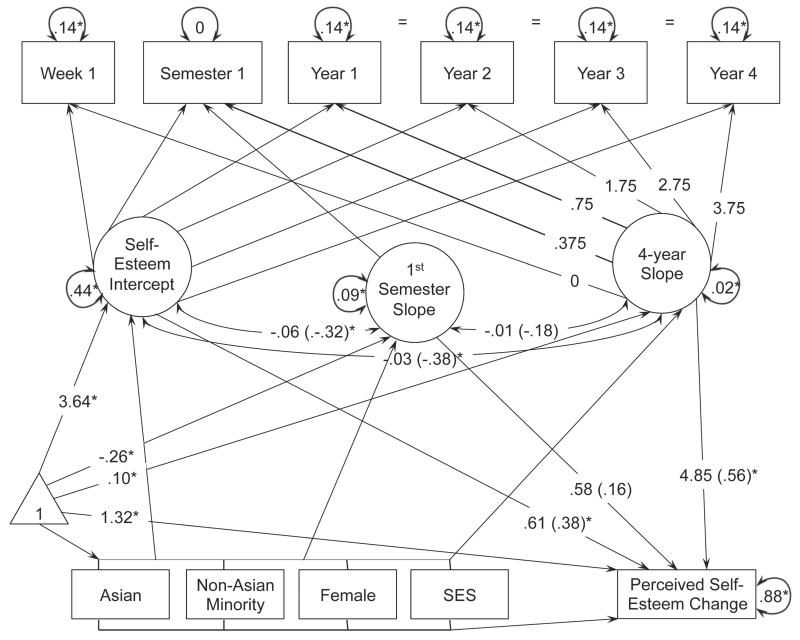
Figure 5.
Correspondence between self-esteem trajectory and perceived self-esteem change (Model 5). Coefficients for demographic variables are presented in Table 6. Unstandardized estimates are presented in the figure. Standardized estimates are in parentheses. SES = socioeconomic status. * p < .05.

