Figure 3.
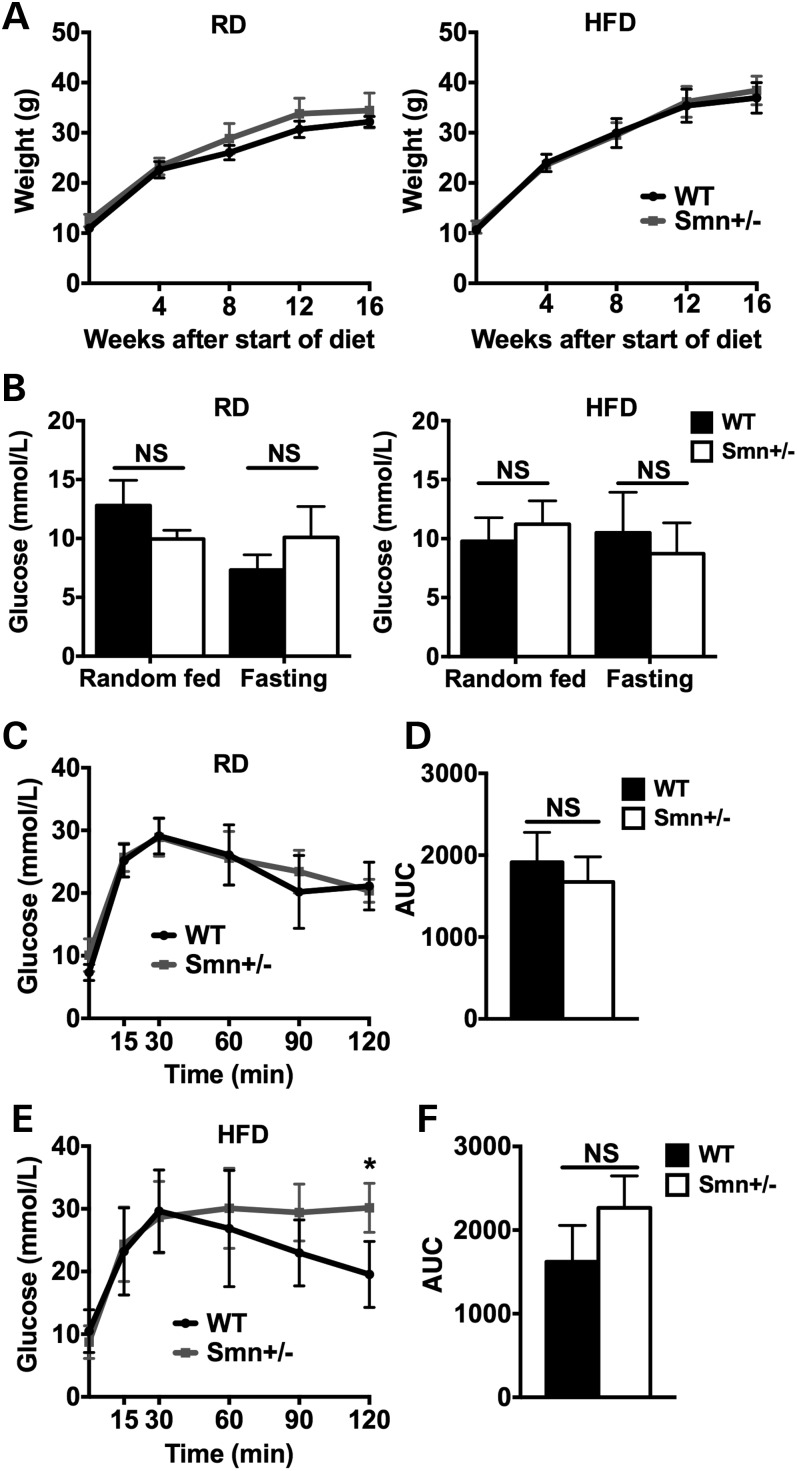
Diet-induced obesity affects glucose clearance in Smn+/− mice. At P21, WT [n = 5 (RD), 4 (HFD)] and Smn+/− [n = 4 (RD and HFD)] males were placed either on a regular (RD) or high-fat diet (HFD) for 16 weeks. Mice were weighed every 4 weeks. At the end of the 16-week diet, mice were fasted overnight, followed by an IPGTT test. (A) Comparison of weight curves of mice on the RD (left) and HFD (right) shows similar weight gains between WT and Smn+/− mice. (Data are mean ± SD; multiple t-test.) (B) Glucose levels of random fed and fasted WT and Smn+/− mice on both the RD (left) and HFD (right) are not significantly different. (Data are mean ± SD; two-way ANOVA; NS, not significant.) (C) Comparison of IPGTT curves of WT and Smn+/− mice on the RD reveals similar glucose clearance between groups. (Data are mean ± SD; multiple t-test.) (D) The IPGTT AUC of WT and Smn+/− mice on the RD are not significantly different. (Data are mean ± SD; t-test; NS, not significant.) (E) Comparison of IPGTT curves of WT and Smn+/− mice on the HFD displays significantly more glucose in Smn+/− mice 120 min following the IP of glucose. (Data are mean ± SD; multiple t-test; *P = 0.01.) (F) Comparison of the IPGTT AUC of WT and Smn+/− mice on the HFD is not significantly different. (Data are mean ± SD; t-test; NS, not significant.)

