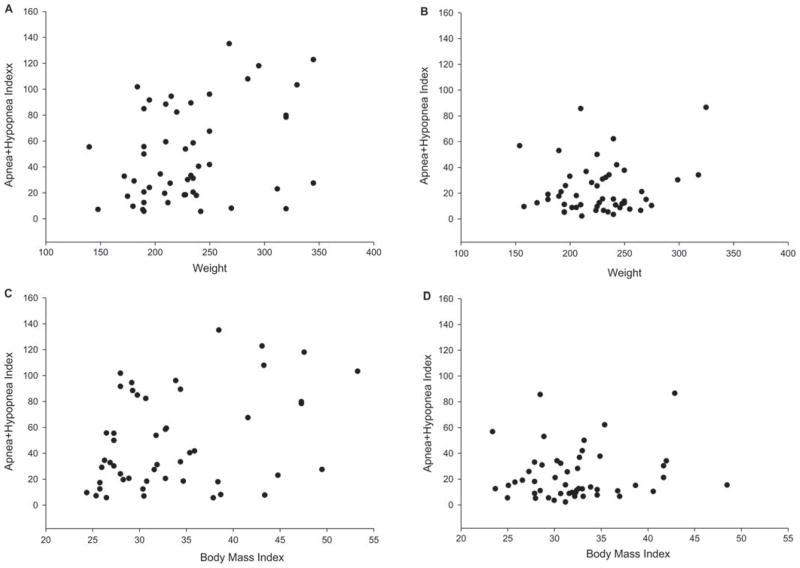
FIGURE 1.
Panels A and B show the correlation between weight and apnea + hypopnea index in the control and World Trade Center Medical Monitoring and Treatment Program (WTCMMTP) population. A significant and positive correlation (r = 0.29, P = 0.044) was found only in the control population (panel A). Panels C and D show the correlation between body mass index and apnea + hypopnea index in the control and WTCMMTP population. Again a significant and positive correlation (r = 0.36, P = 0.0096) was found only in the control population (panel C).

