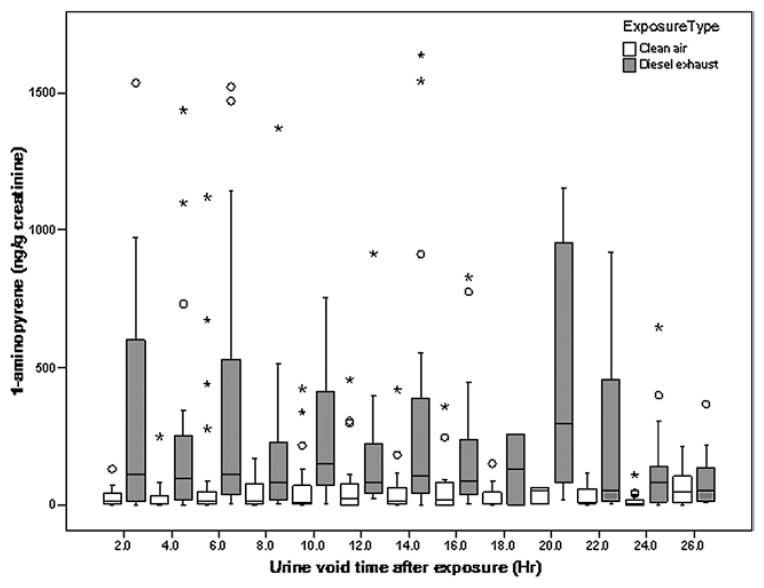
Fig. 2.
Box plot showing distribution of urinary 1-AP concentrations for all samples at 2 h intervals following DE exposure and clean air exposure. The number of urine samples in each time interval ranges from two to 34. The larger appearing median concentration for DE at the ≥18 to <20 h interval is based on only five samples. Sixteen data points of 1-AP concentration > 200 μg mol−1 creatinine are not shown. The boxplots show the 25th, 50th and 75th percentiles within the box. The largest and smallest non-outliers (within 1.5 times the interquartile range (IQR) from the first and third quartile) are marked by ‘whiskers’, and mild outliers (from 1.5 to three times the IQR from the first and third quartile) and extreme outliers (more than three times the IQR from the first and third quartile) and are marked with open circles and stars respectively.

