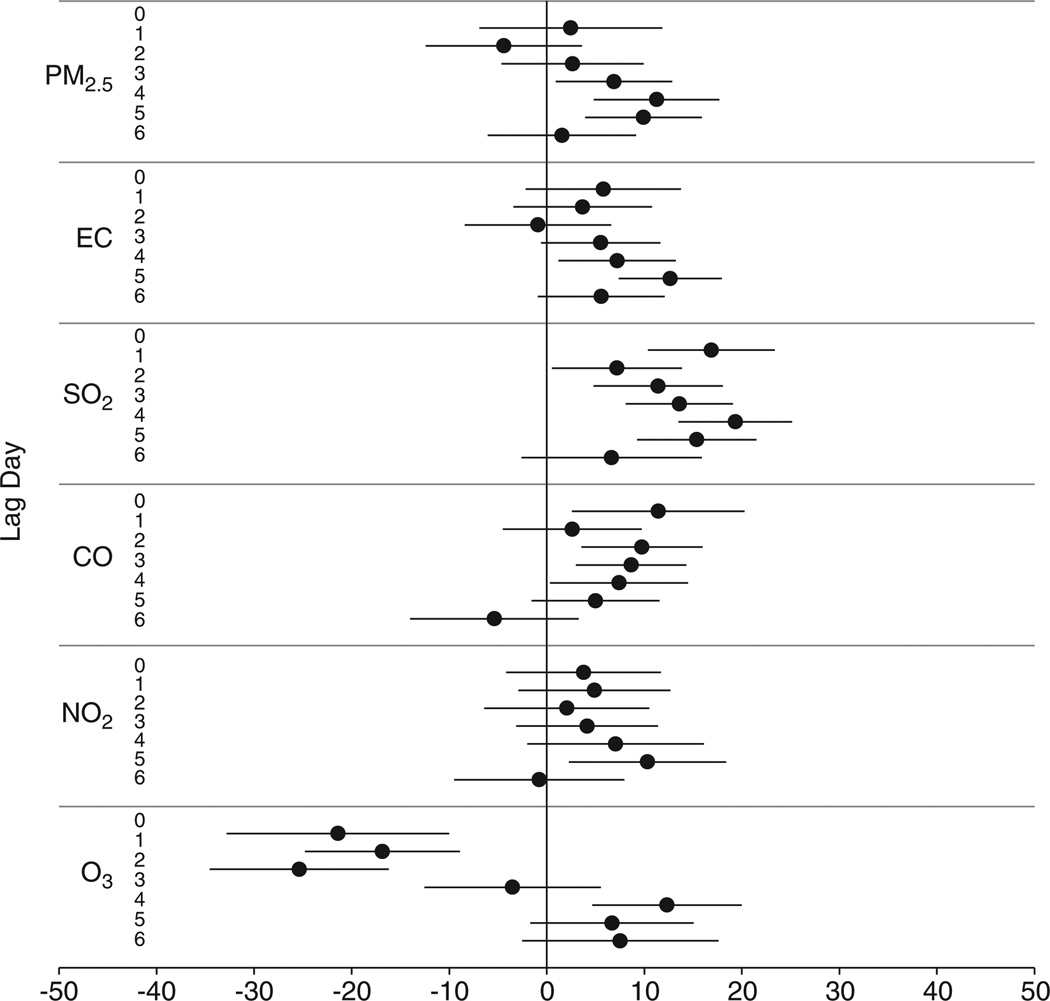
Figure 2.
Percentage change in EBC MDA concentration associated with each interquartile range (IQR) increase in pollutant concentration, by lag day. Generated using mixed-effects models controlling for temperature (degree of freedom in natural spline = 1), RH (df = 1), 6-day moving average of temperature (df = 3), 3-day moving average of RH (df = 3), gender, and day of week.

