
Fig. 1.
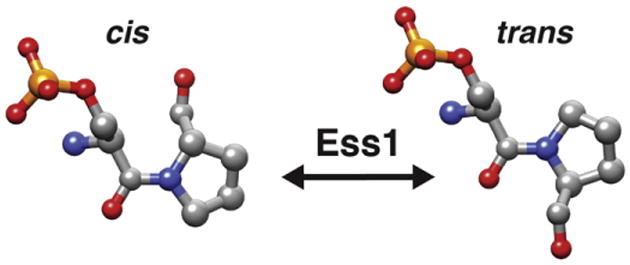
Model for phospho-Ser-Pro peptidyl bond isomerization. cis and trans isomers are shown. Note the 180° difference in the position of the proline's carbonyl group. Oxygens are shown in red, nitrogens in blue, carbons in gray, the phosphate in orange.