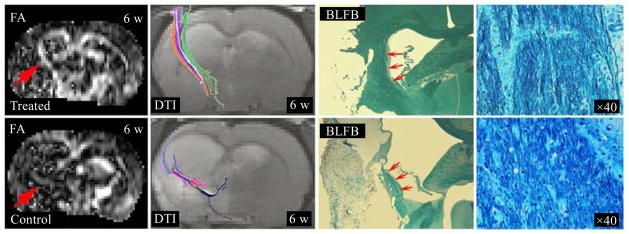
Fig. 11.

In a sildenafil treated rat, FA map acquired 6 w after stroke revealed axonal remodeling with higher FA values (red arrow). DTI tracked reorganized high density and long fibers along ischemic boundary, which coincided with the increased FA value area. BLFB staining section verified the DTI findings (red arrows), axonal fibers were much clearer in the magnified picture (40x). In a saline treated rat, DTI demonstrated weakly elevated FA values, sparse and short fibers along ischemic boundary, and BLFB pictures were coincident with DTI images
