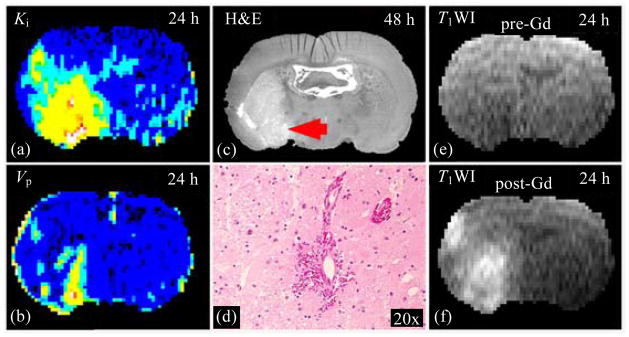
Fig. 7.

Ki (a) and Vp (b) maps, obtained at 24 h post embolization, exhibited elevated values at a region where histological H&E stained section (c), obtained at 48 h after stroke, identified the microscopic hemorrhage, which can be seen under microscopy with 20 times magnification (d). Due to BBB disruption, T1WI images acquired pre- (e) and post-injection (f) of Gd-DTPA at 24 h after MCAo showed contrast enhancement
